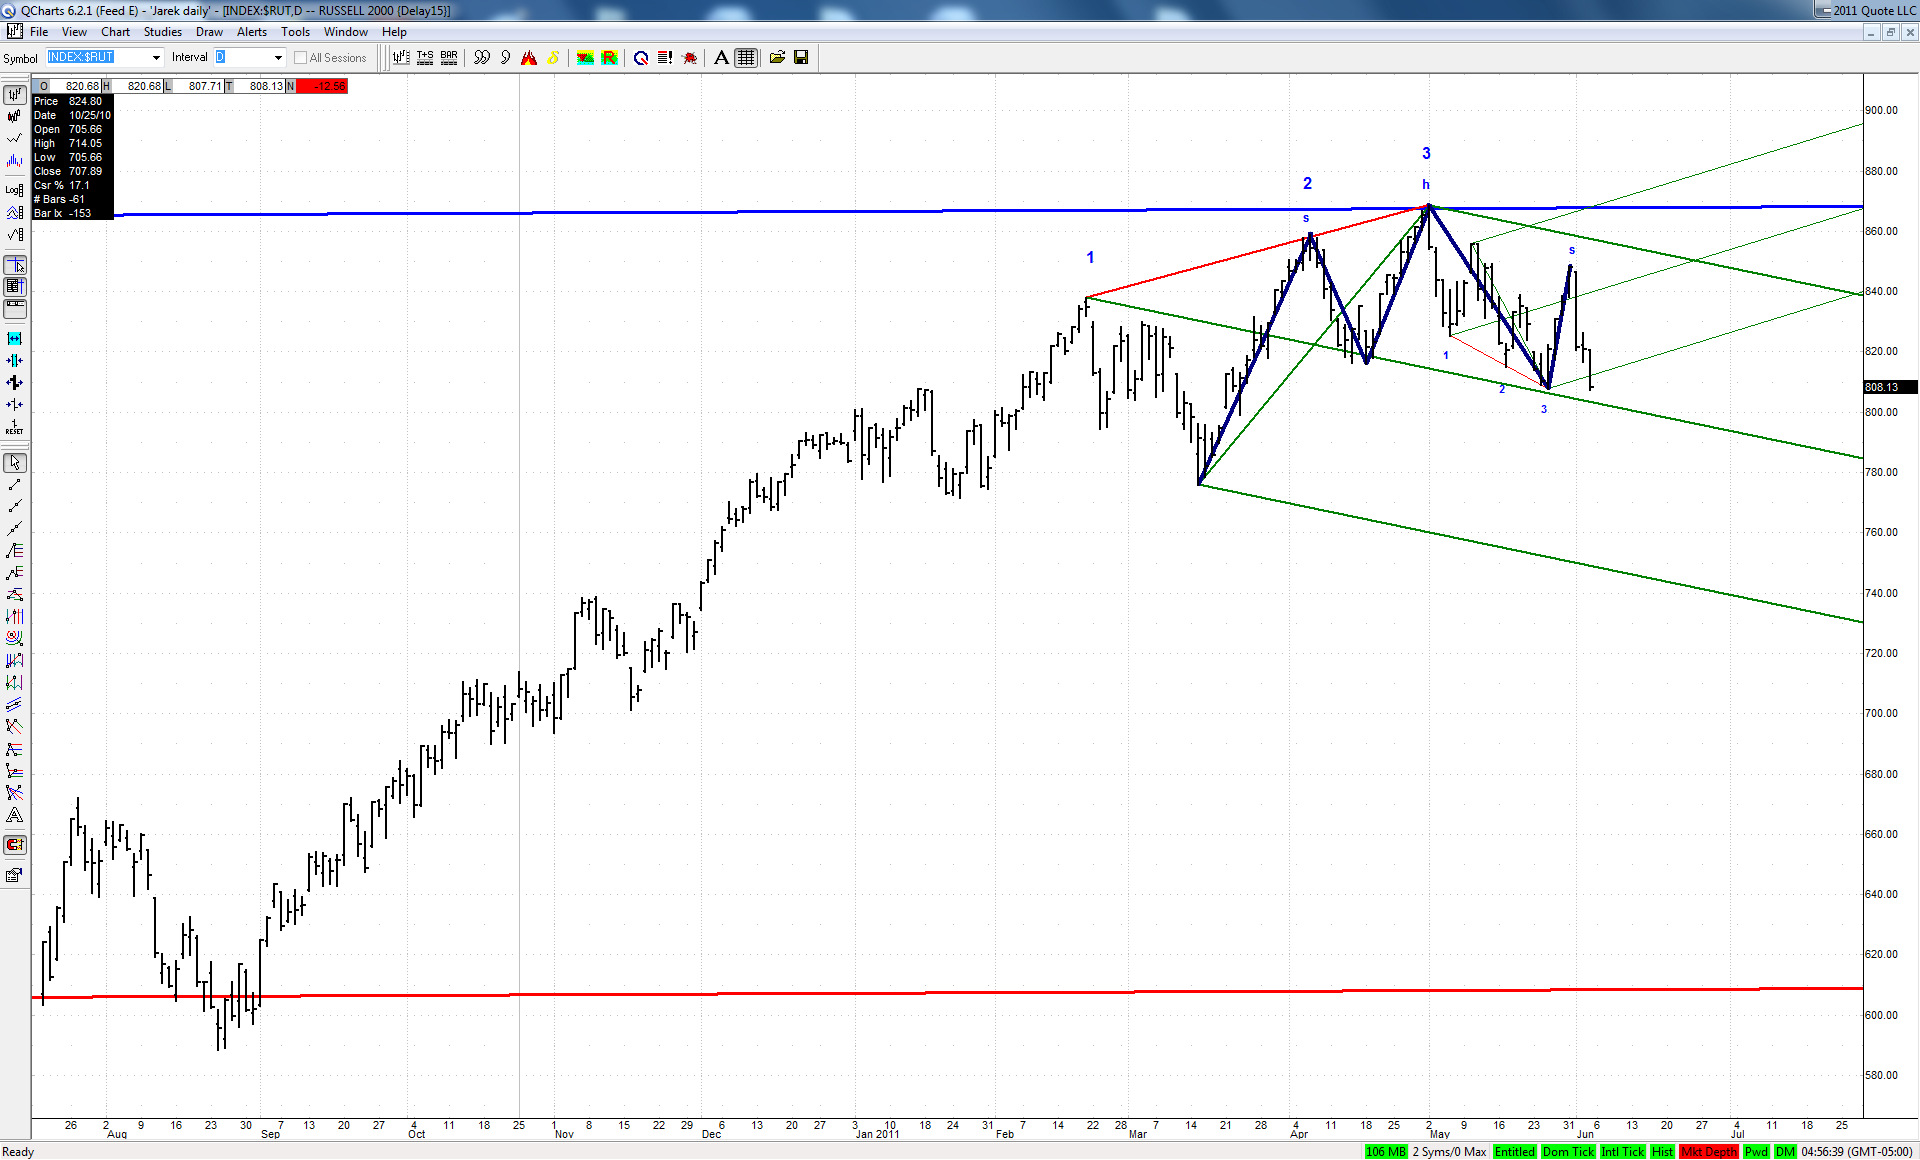
Jim suggested to take a look at daily charts of some secondary indexes and here is my current $RUT chart:
The green ML of a set based on big bearish 3D happens to be also a neckline of a classic head and shoulders. If bulls would not be able to defend this line next week, then a move to the lower ML should follow. This would also be a perfect fulfillment of a successful H&S pattern.
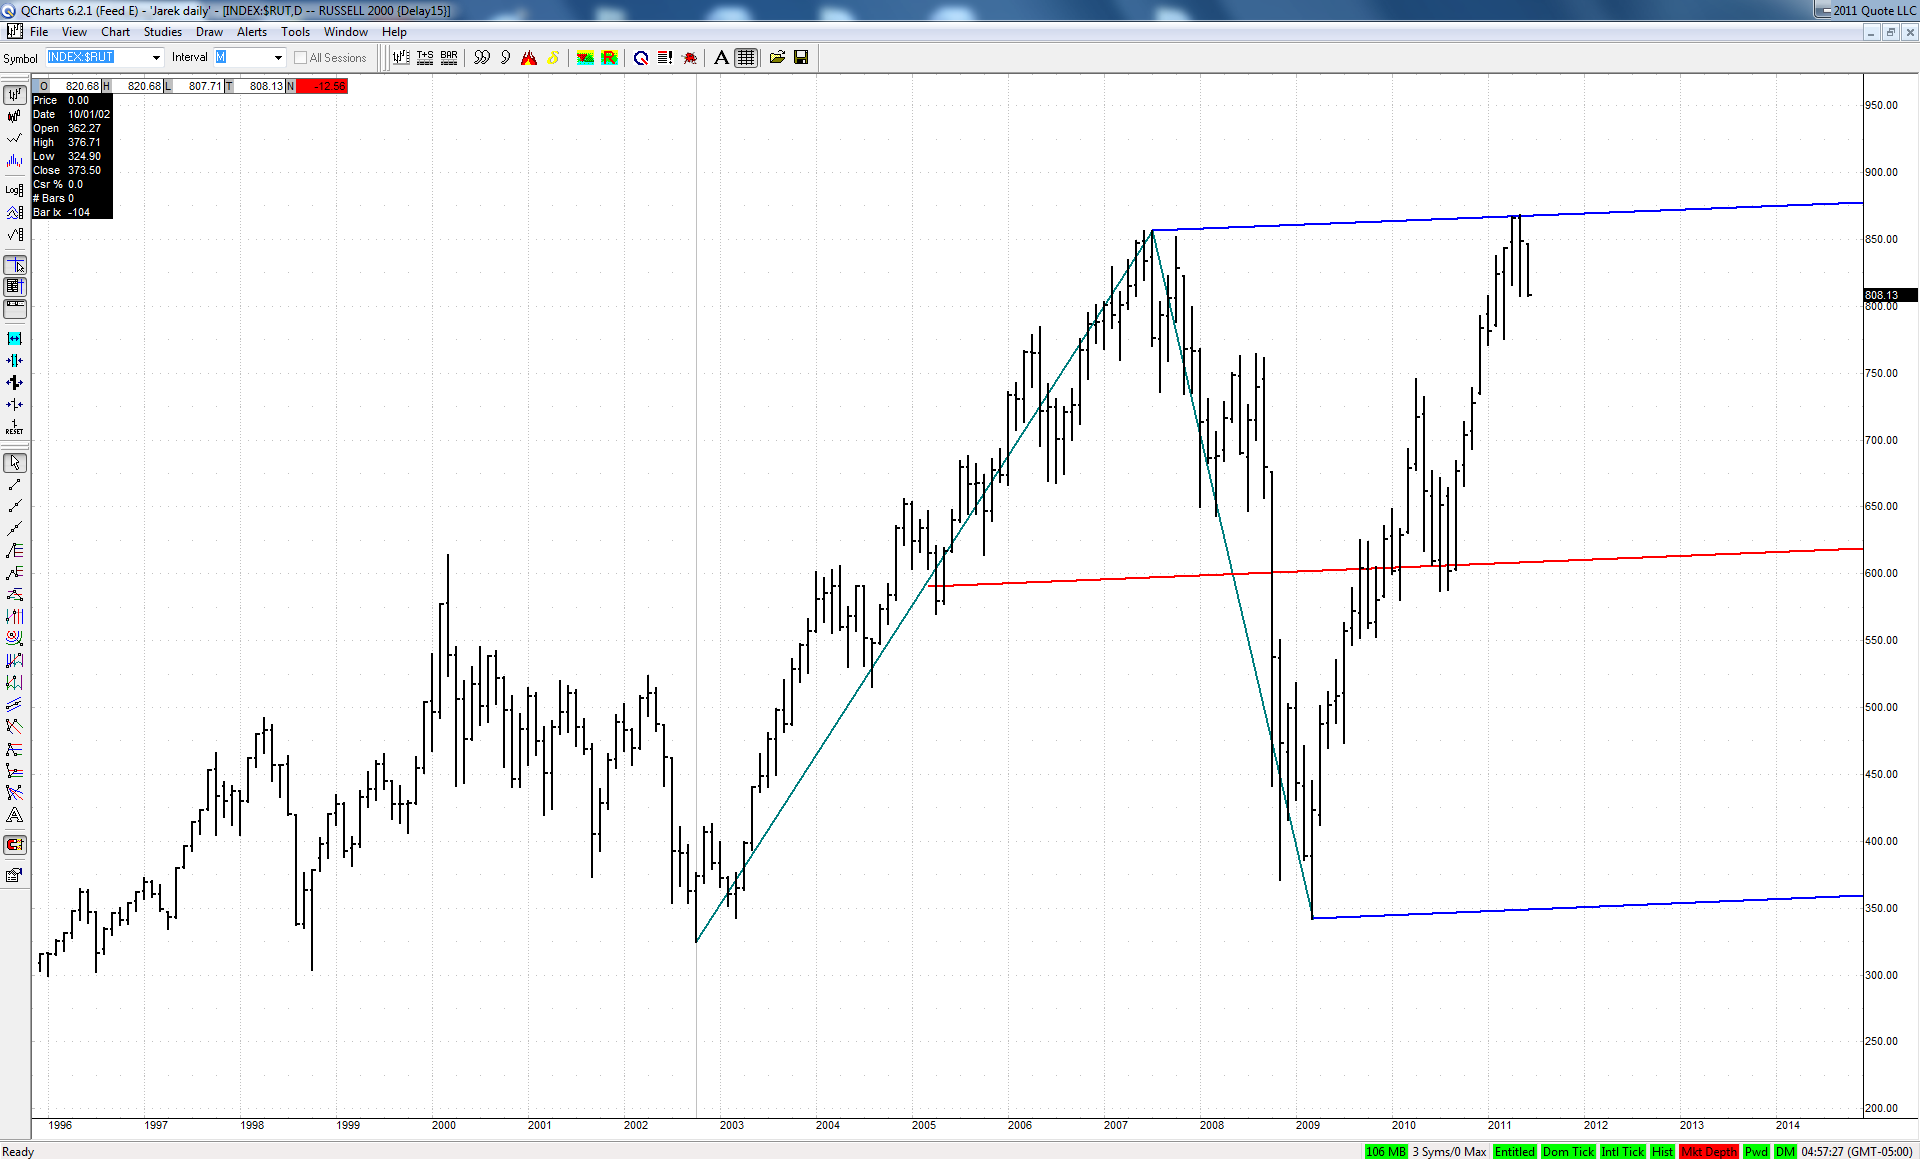
It is all the more interesting as this big bearish 3D fell dead on at the upper ML of a quite important set:
JI
jimkane
Rep: 3,058
Posts: 33,089
Not a bad read there.
Posted-06/08/2011 : 18:02:15
Originally posted by jimkane
I'm long side bias into GLOBEX here. Understand, I am talking very short term here, for a GLOBEX 'daytrade'. If it moves, I'd be looking to stay with that bias until it stops moving. Long until wrong, as they say.
Originally posted by jimkane
It hit 75.25 and is bouncing. Is this it? Or another bounce they'll sell? And with rollover, and the Sept contract being 5.50 lower, that skews the continuous contract chart quite a bit. So, how to handle that? There isn't a good answer. I'll still chart the June contract on the higher timeframe for awhile.
Originally posted by jimkane
If they drop it, I'm watching 73.50-75, and 71.50, give or take.
JI
jimkane
Rep: 3,058
Posts: 33,089
Note this is a key area this has been struggling with. Note my question marks.
JI
jimkane
Rep: 3,058
Posts: 33,089
How far has it run? How big were the corrections on the way up? Does it need a bigger correction? What is it up against in this area? Is this a high odds setup?
JI
jimkane
Rep: 3,058
Posts: 33,089
89-90 is the next level, perhaps as high as 91, though. In there I will see if this is just a single push, or the start of another big impulsive leg.
RA
rat89
Rep: 0
Posts: 7,015
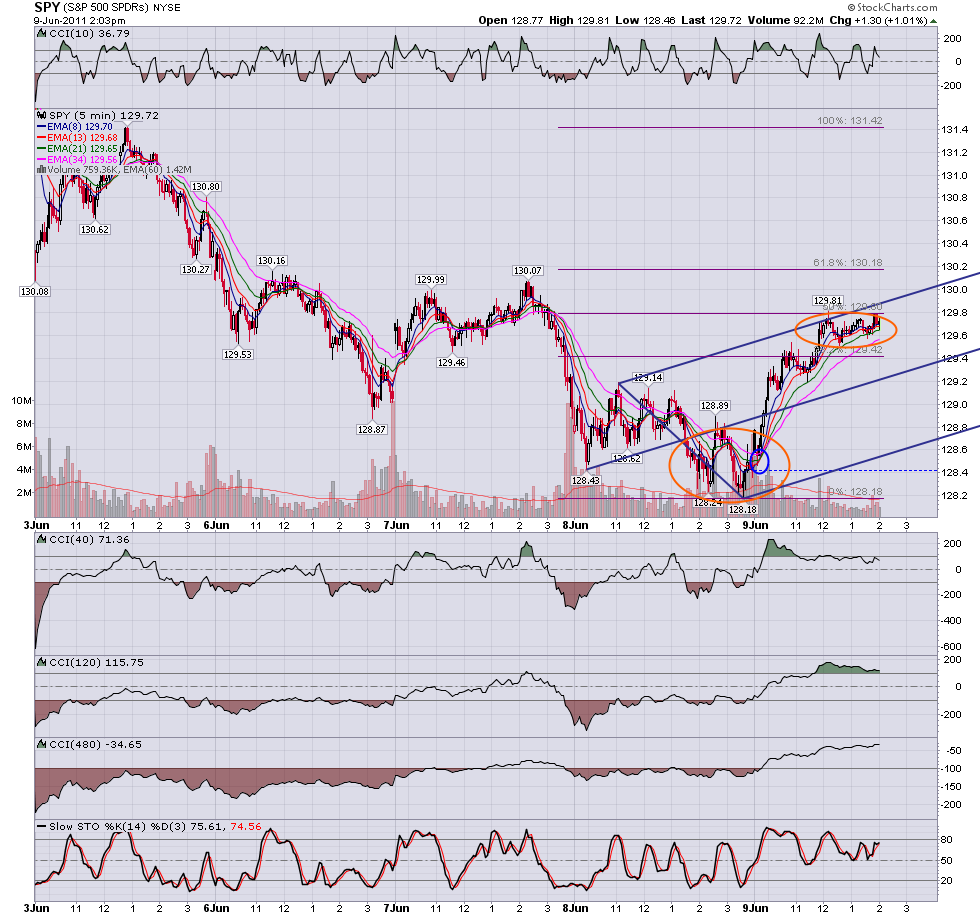
it's interesting to note the difference in volatility in the two circled areas....what it's doing now seems like a version of the creep, where the hits at the line don't aren't coming from swings that indicate a high probability counter move down at this moment. think they'll pin it to 130 area into the close, in accordance with your theory of closing at key levels?
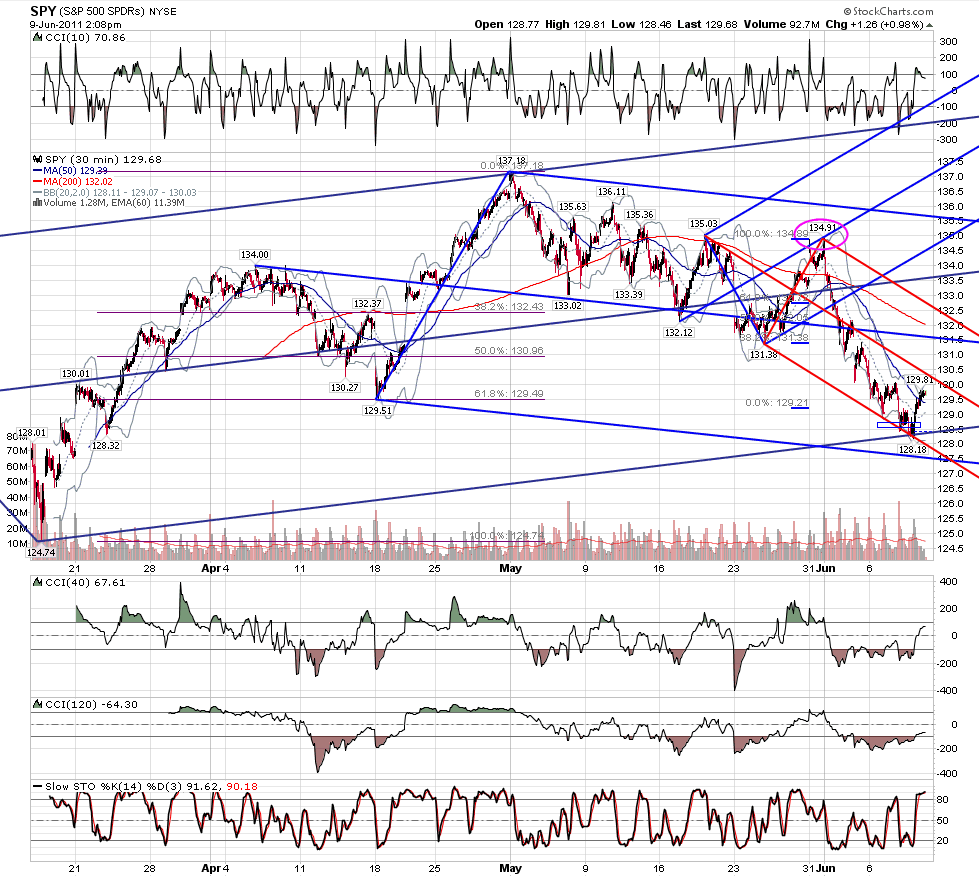
which would roughly coincide with a most interesting area at the median line of the set that brought it down...
Originally posted by jimkane
How far has it run? How big were the corrections on the way up? Does it need a bigger correction? What is it up against in this area? Is this a high odds setup?
which would roughly coincide with a most interesting area at the median line of the set that brought it down...
JI
jimkane
Rep: 3,058
Posts: 33,089
Good observations. If it were closer to the close I'd think so. But, with this much time in this correction I'm thinking it will break up. I do have reservations, in that I've seen them sell lately in situations like this. I can't see that today, since it is now 'risk on'.
Originally posted by rat89
it's interesting to note the difference in volatility in the two circled areas....what it's doing now seems like a version of the creep, where the hits at the line don't aren't coming from swings that indicate a high probability counter move down at this moment. think they'll pin it to 130 area into the close, in accordance with your theory of closing at key levels?
Originally posted by jimkane
How far has it run? How big were the corrections on the way up? Does it need a bigger correction? What is it up against in this area? Is this a high odds setup?
which would roughly coincide with a most interesting area at the median line of the set that brought it down...