MyPivots
Sign In
JA
jarek
Rep: 94
Posts: 3,474
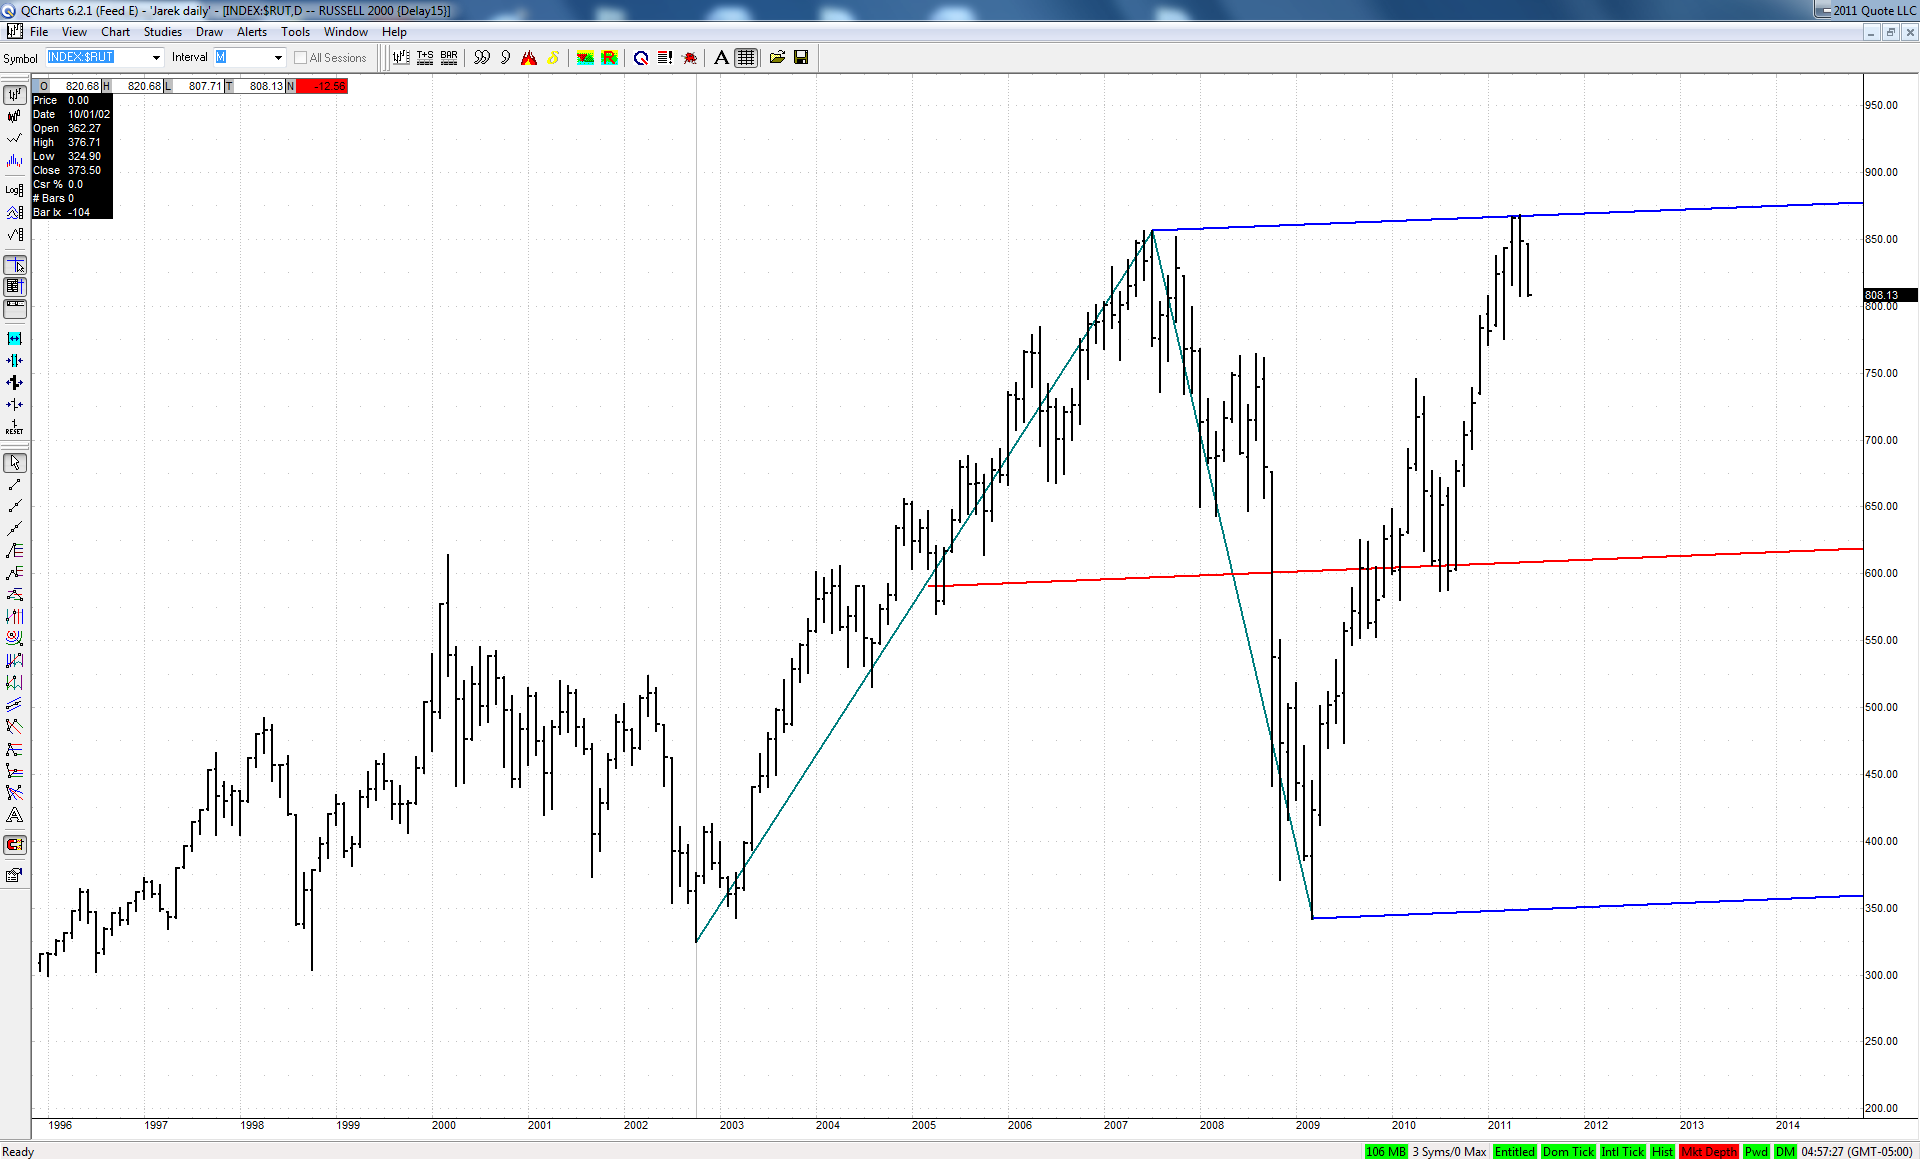
Jim suggested to take a look at daily charts of some secondary indexes and here is my current $RUT chart:

Click image for original size
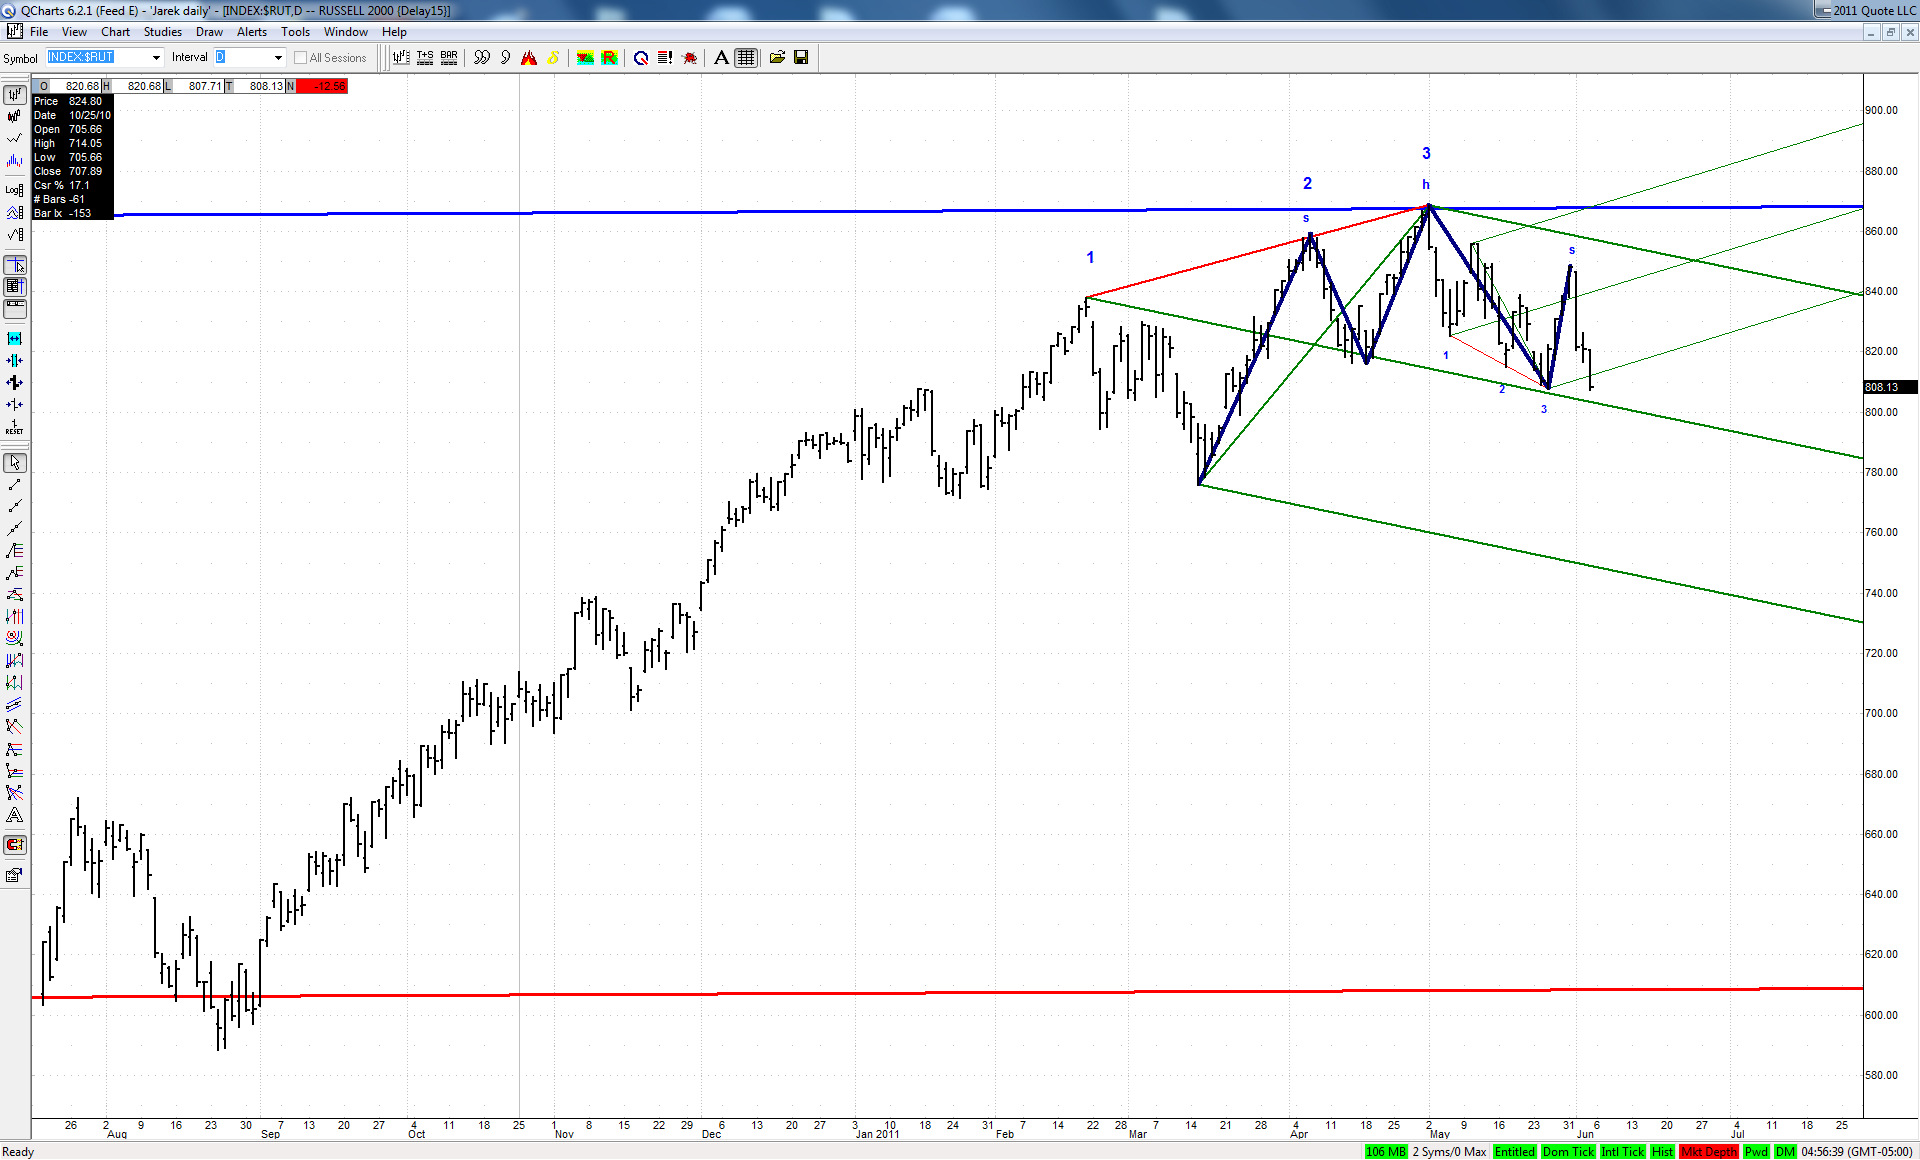

The green ML of a set based on big bearish 3D happens to be also a neckline of a classic head and shoulders. If bulls would not be able to defend this line next week, then a move to the lower ML should follow. This would also be a perfect fulfillment of a successful H&S pattern.
It is all the more interesting as this big bearish 3D fell dead on at the upper ML of a quite important set:

Click image for original size
JI
jimkane
Rep: 3,058
Posts: 33,089
Yes, the Socratic approach would probably be my favorite way to have verbal discussion with someone. It just isn't feasible in here. People don't realize, I think, just how challenging what I am trying to do in here is, with such limited time and such a restrictive venue. Imagine producing quality content, trying to short-term daytrade at the same time, and finding the motivation to do it all for free. I've been posting in the private forum going on five years now. It ain't easy. Over 10,000 posts. I'm just saying, it isn't as 'easy' as it looks.
JI
jimkane
Rep: 3,058
Posts: 33,089
Gotta love this downside aftermarket action.
Note where the areas are, one just below, though. This is overdue for a bigger bounce.
JI
jimkane
Rep: 3,058
Posts: 33,089
I'll keep this short, and just post the center of the areas. You know my average area width at the timeframe I usually post for. Next I'm watching 86.50, then 91. After that I'll let everyone do the work. It's not too hard to see the next levels.
JA
jarek
Rep: 94
Posts: 3,474
Watching the reaction to such KZ TD ABCD:

Click image for original size
JA
jarek
Rep: 94
Posts: 3,474
Originally posted by jarek

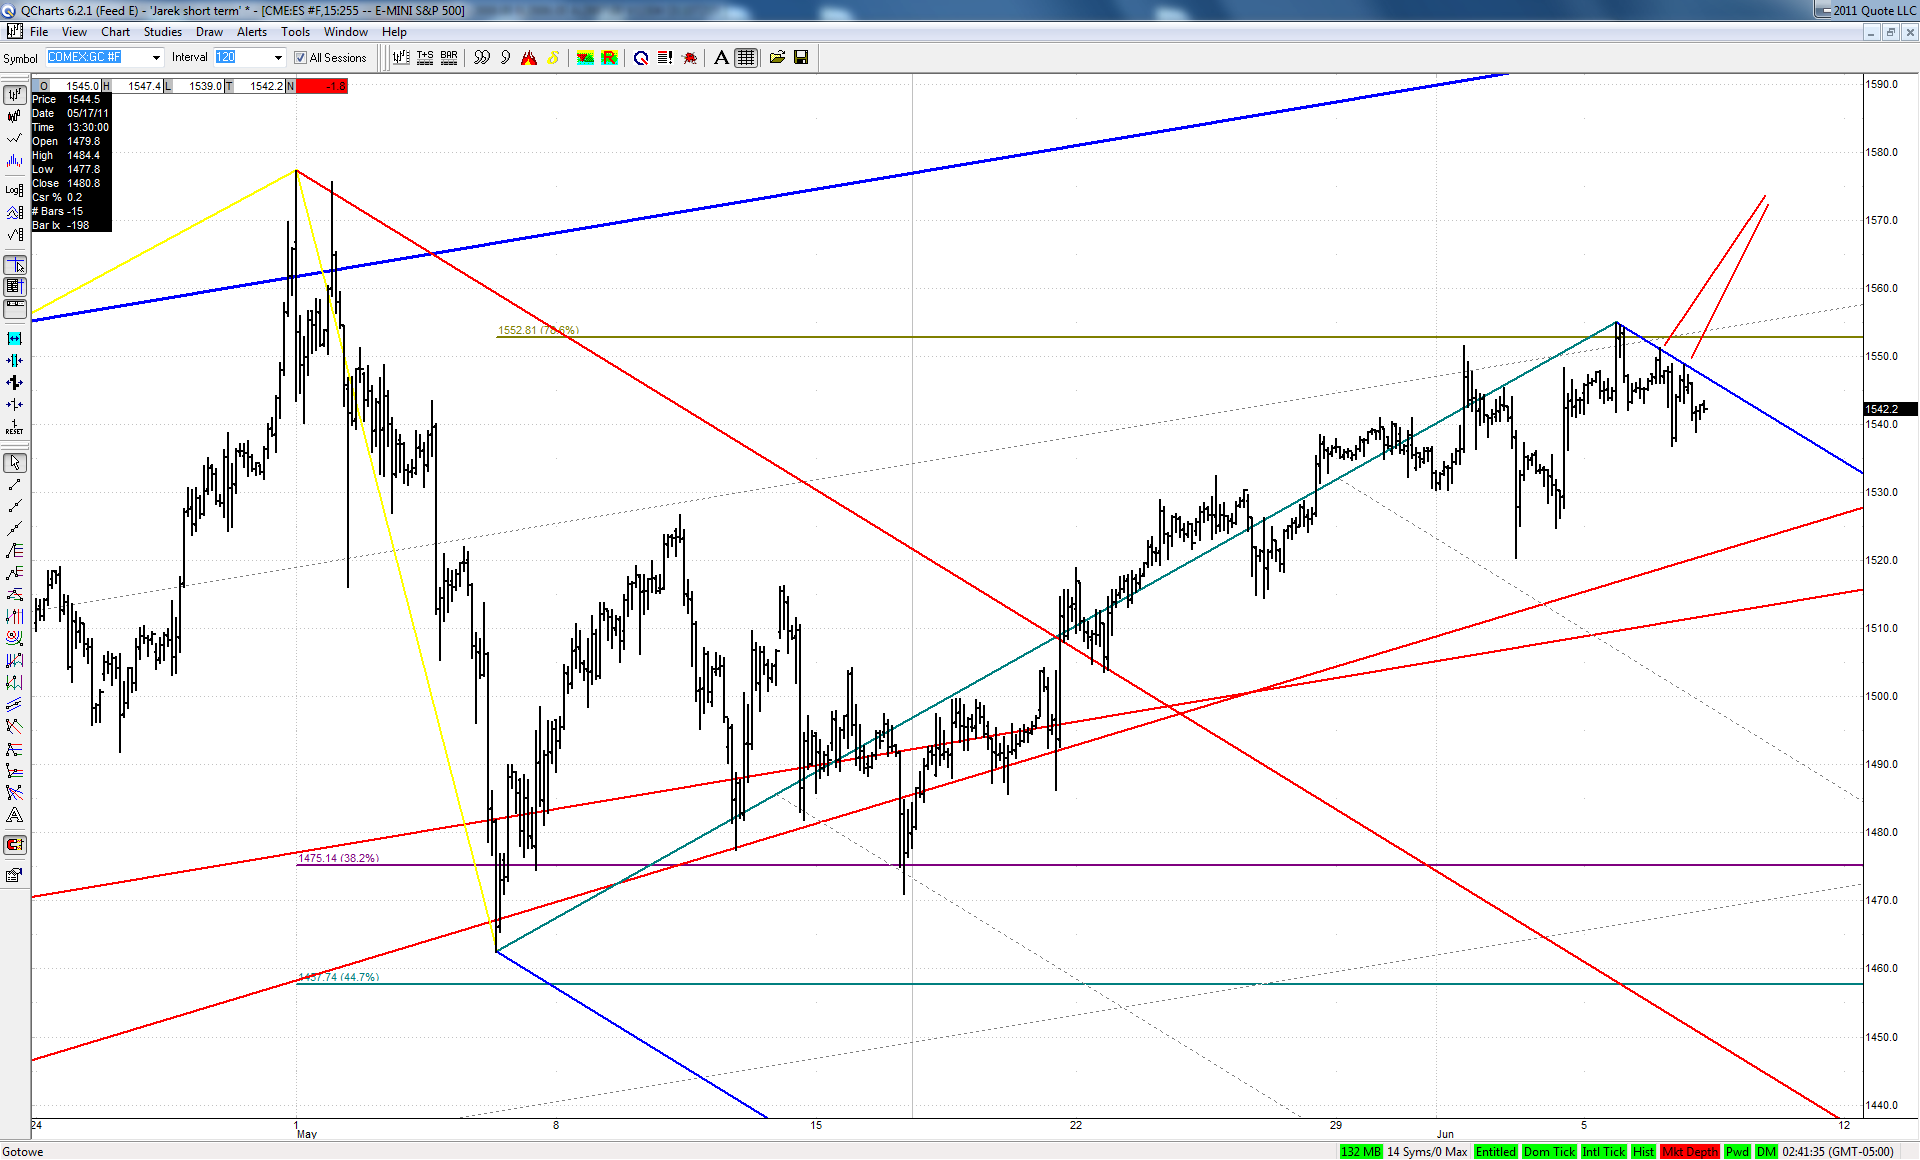
Little more effort and we will have a well known here setup in Gold

Hmm...

Click image for original size
JA
jarek
Rep: 94
Posts: 3,474
Originally posted by jarek

Watching the reaction to such KZ TD ABCD...

Played out fully already with slightly higher D point than in original setup above:

Click image for original size
RA
rat89
Rep: 0
Posts: 7,015
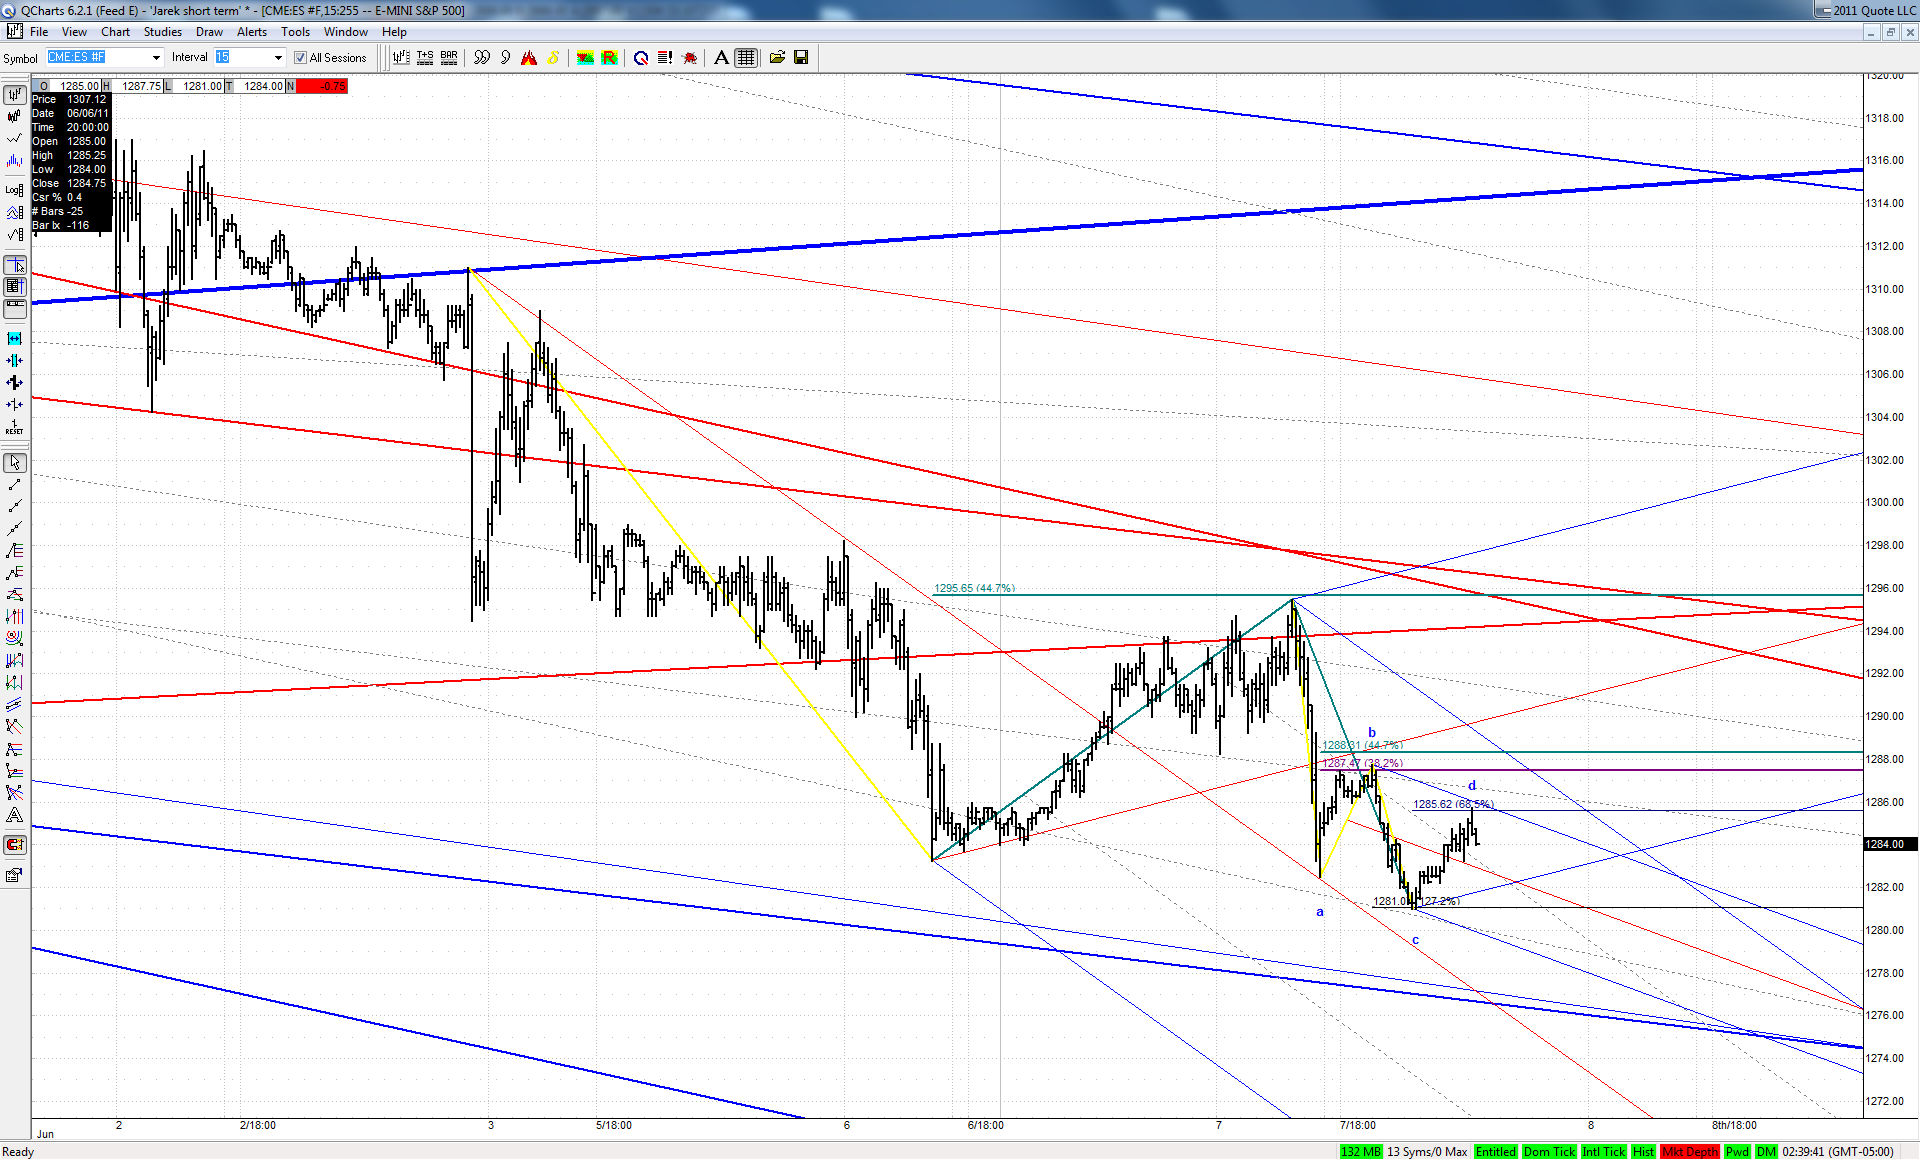
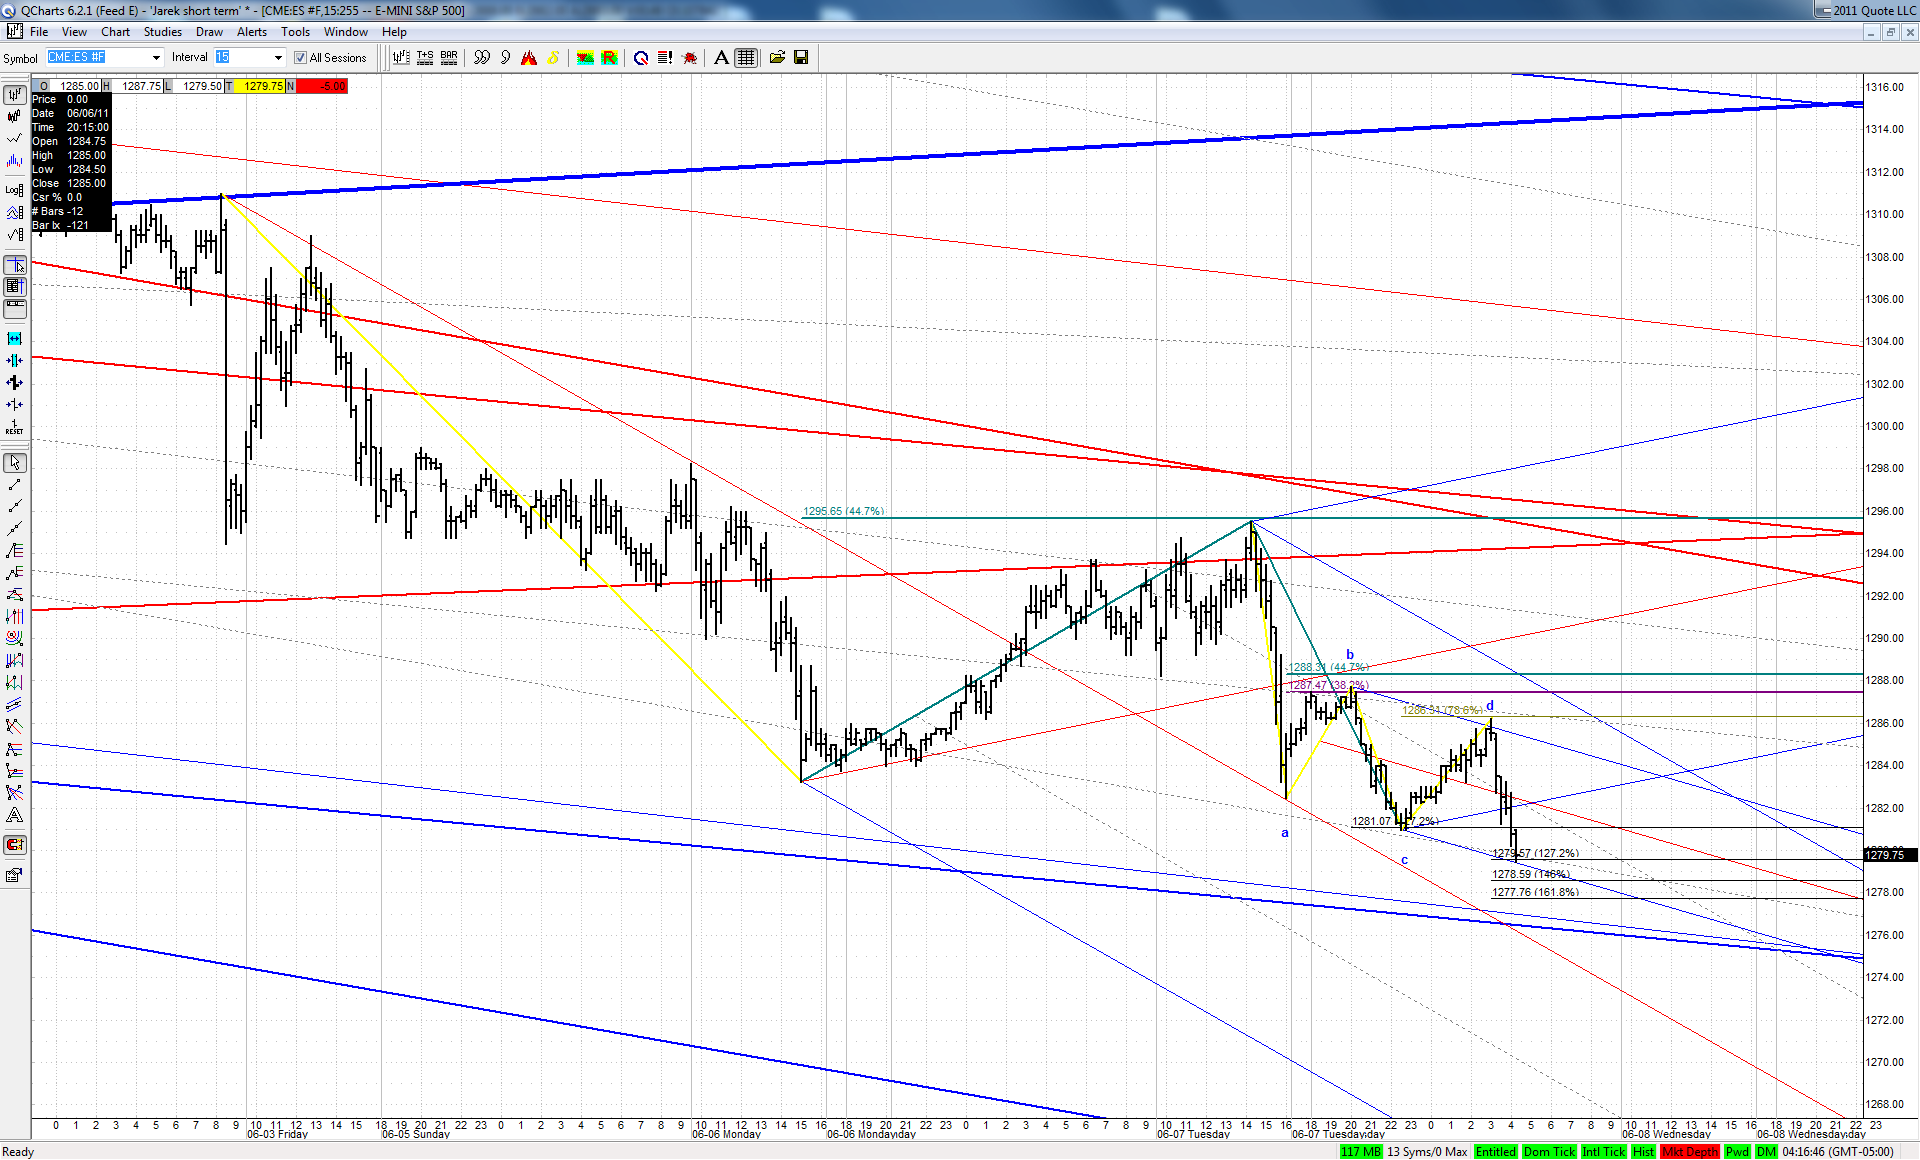
there are some very interesting areas coming up here......1.46 dbs at 7887 - 7896 (blue line), 886 of march low at 7848, 1.618 dbs at 7823 - 7811.....

every trader I know is bearish, even the bulls

7965 turned it for a day before failing, which said get out of the way and look for the next level.....
Click image for original size
JA
jarek
Rep: 94
Posts: 3,474
The low so far was exactly at lines confluence, but just downsloping lines - I don't have an upsloping line here:

Click image for original size
JA
jarek
Rep: 94
Posts: 3,474
Potential breaking of the sequence of bearish KZ ABCDs could suggest that more important bottom is in place:

Click image for original size
TX
tx_ches
Rep: -10
Posts: 514
Originally posted by rat89

there are some very interesting areas coming up here......1.46 dbs at 7887 - 7896 (blue line), 886 of march low at 7848, 1.618 dbs at 7823 - 7811.....

every trader I know is bearish, even the bulls

7965 turned it for a day before failing, which said get out of the way and look for the next level.....


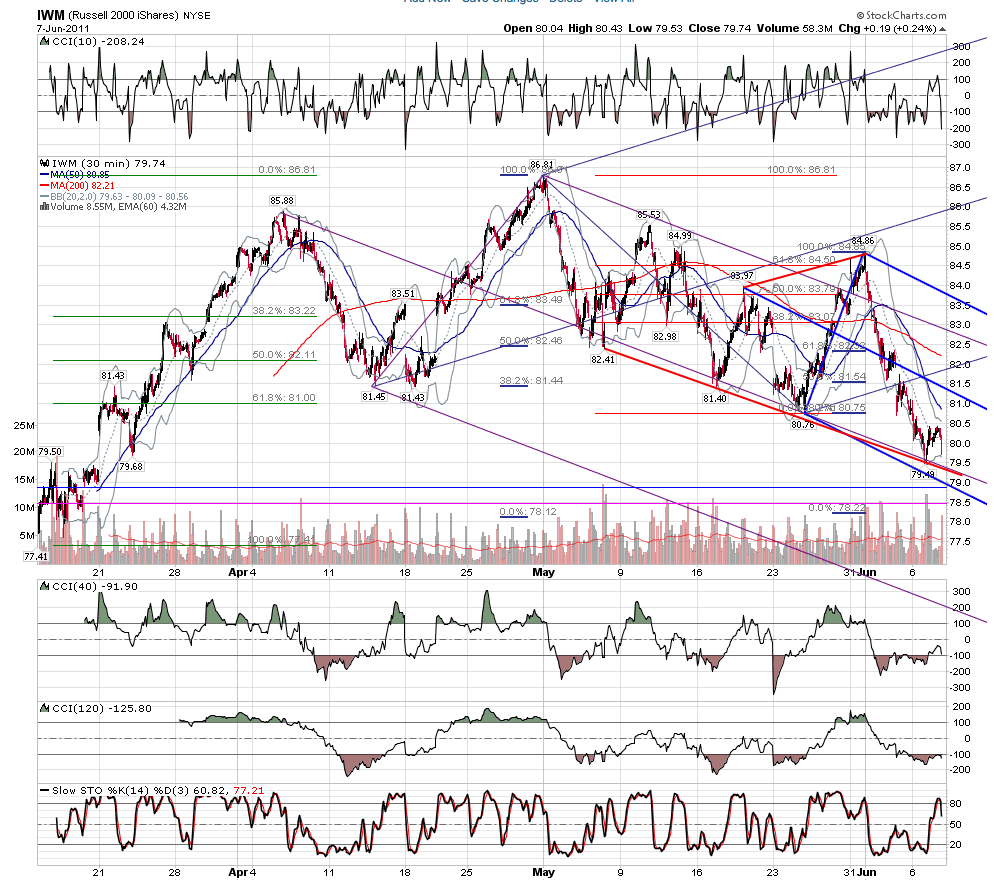
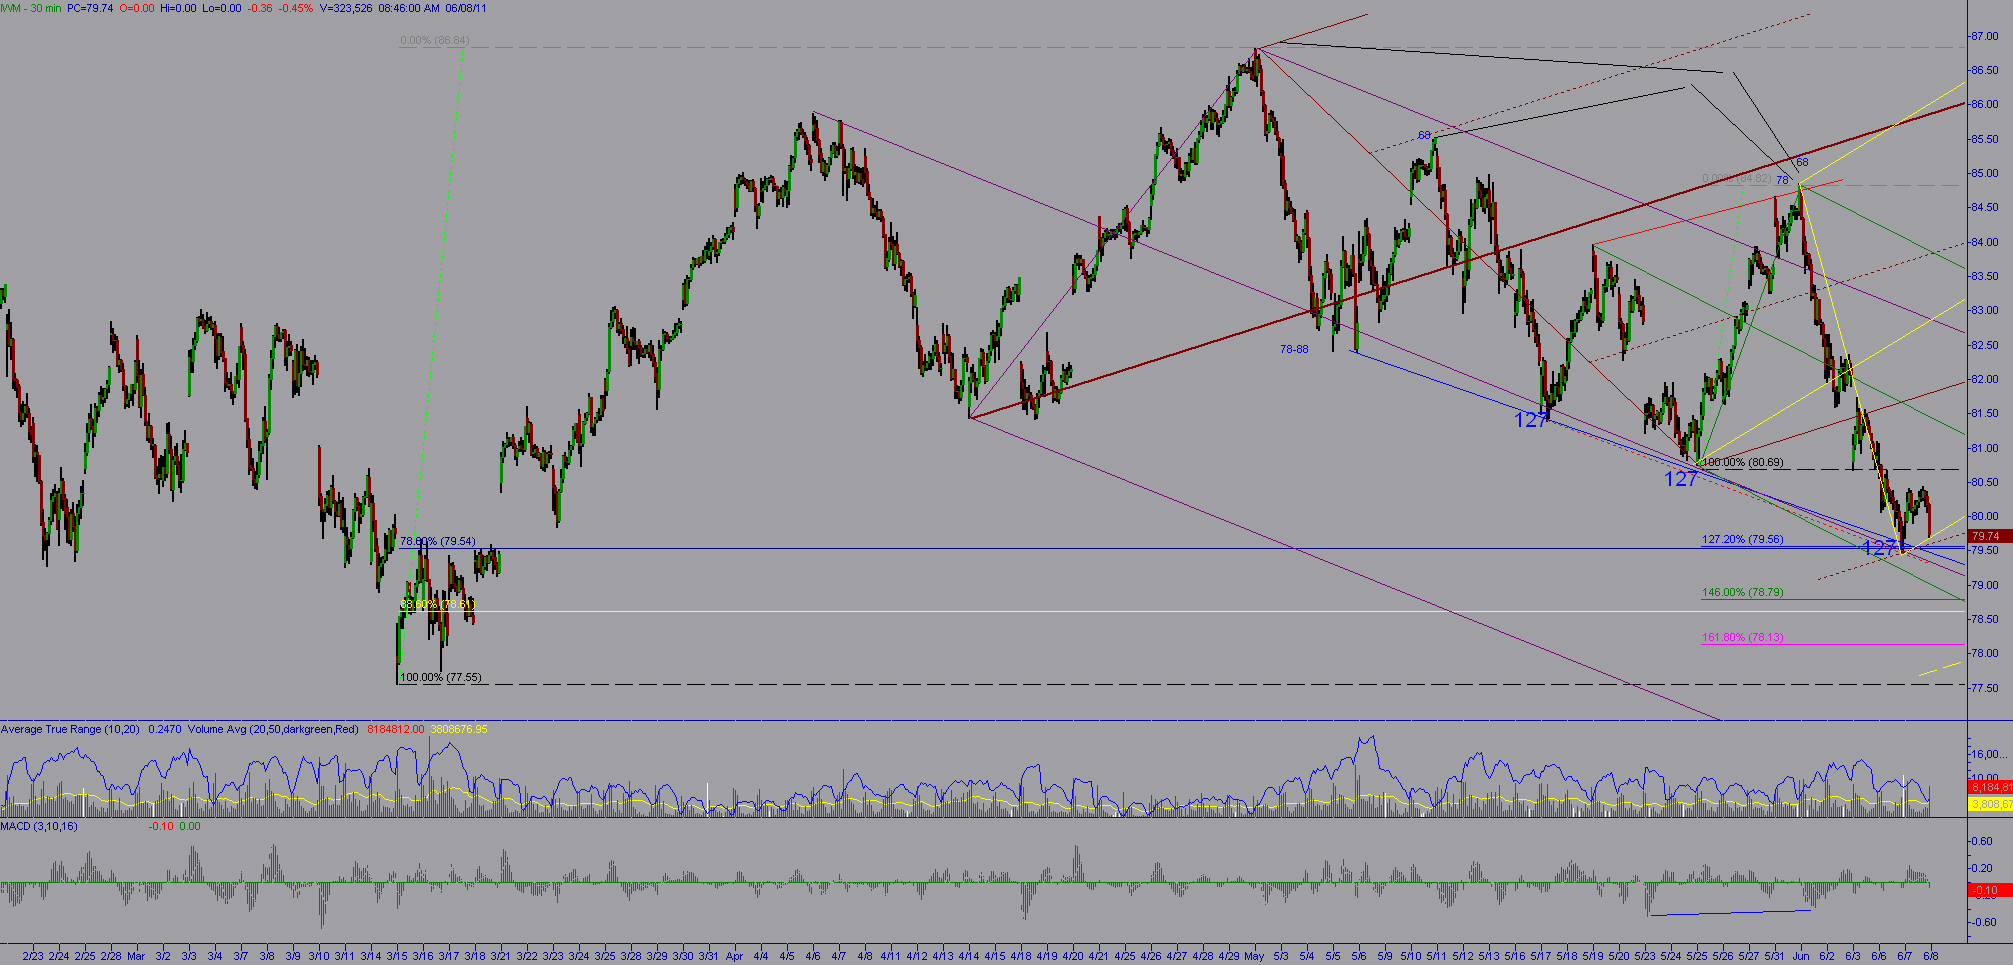
IWM 30 minute.
I've added a yellow set plus a quartile warning line (just past the 25 so not pure quartile WL) plus MAC/CCI div to show there is some support for an upward turn here. Let's be mentally agile to adapt to whatever happens.
But I agree that it'll break through lower based on overnight action in ES and TF (Russell futures).
Worth watching for the DBS.


Click image for original size
RA
rat89
Rep: 0
Posts: 7,015
it might have to, and we'll find out soon


Originally posted by tx_ches

I could certainly see it going lower though.