notes 5516
i am at loose ends. i am no longer a member at any private forums and my handful of students that i have taught at no charge have learned all i have to show and are able to show me my trades.they all saw with great clarity the turn at the january high and they all saw how the geometry forced them to cover at the february low.at a private forum here i wrote on jan 10th''my work suggests a tradeable turn is near.what is remarkable is that those stocks that must rush to the dance must really rush to the dance, suggesting that if a turn is to occur a few stocks must be very strong while most languish. if there is broad strength across the board, a turn will be suspect''
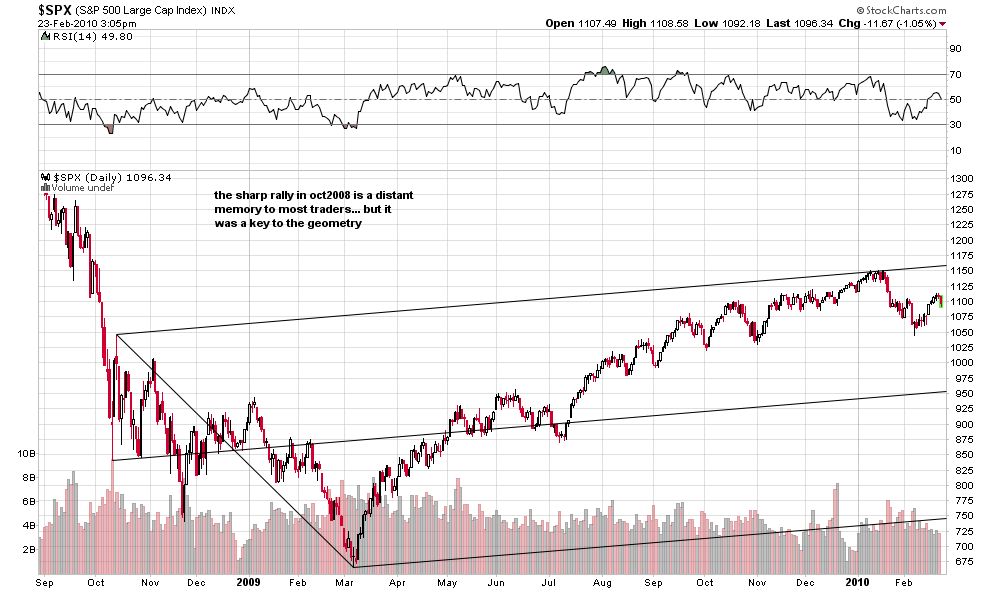
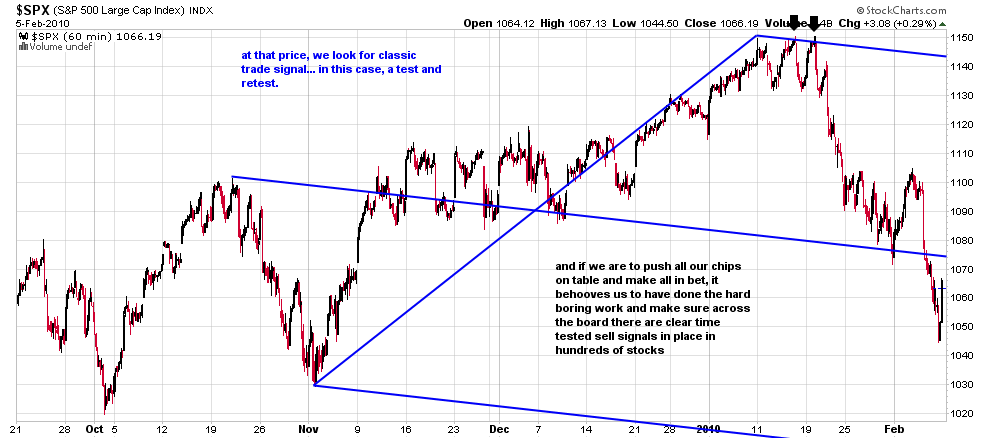
at the moment i wrote that, the spx was at long term resistance and just over 50% of the stocks i follow were on the geometry of sell... on the morning of the 11th on the opening pop i had almost 70% of my stocks on the geometry of sell...price was at long term resistance;70% of my charted stocks were on a sell... what was missing was for the spx to set up a classic test and retest sell signal while i waited for the stragglers( e.g. COF, IBM, QCOM) to complete their geometry of sell. those conditions were met on the close jan19th.at that moment in time, based on the geometry that i trade 95% of my stocks were on sell signals with a classic setup in the spx.at that moment in time there was a technical vacuum below the market that needed resolution... and so i wrote''an exhaustive look at hundreds of stocks suggests to me we are near the years high. i am done now with target trades... i am looking for an all in''
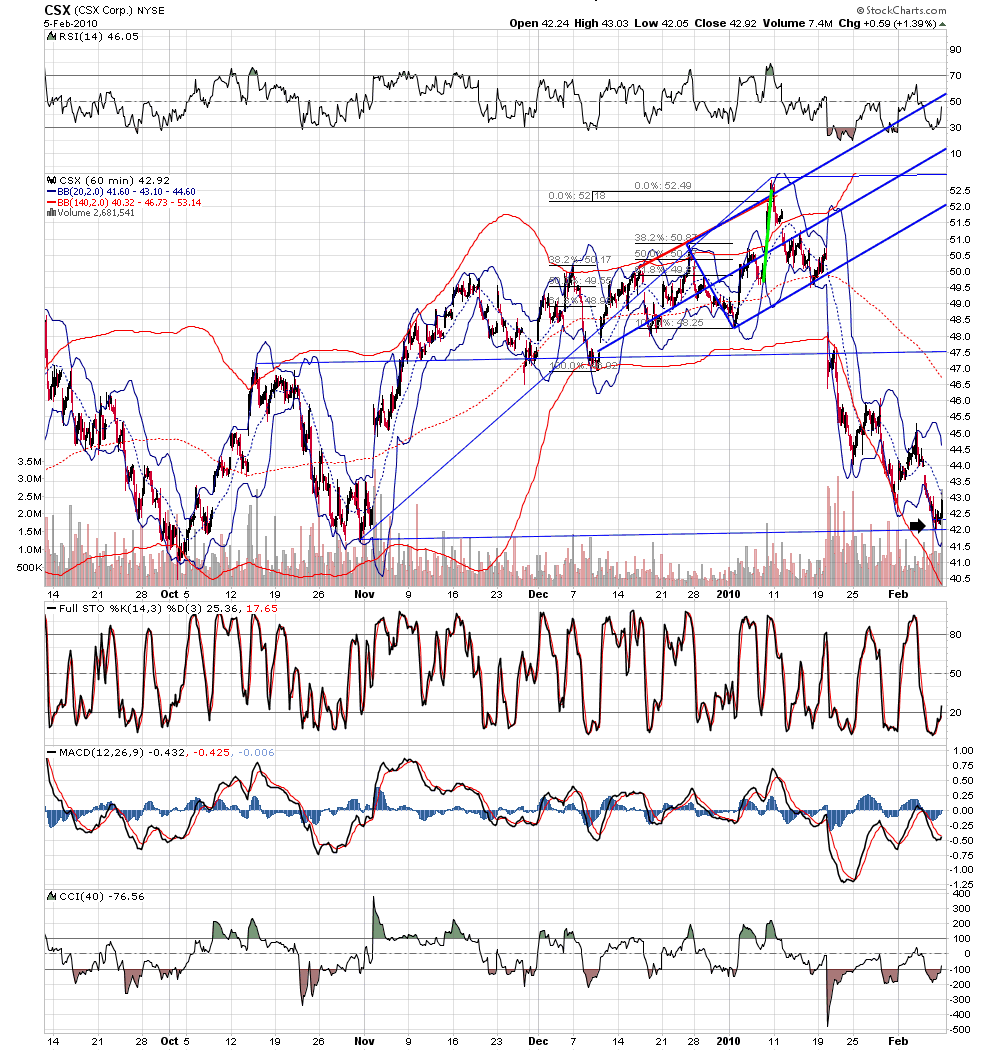
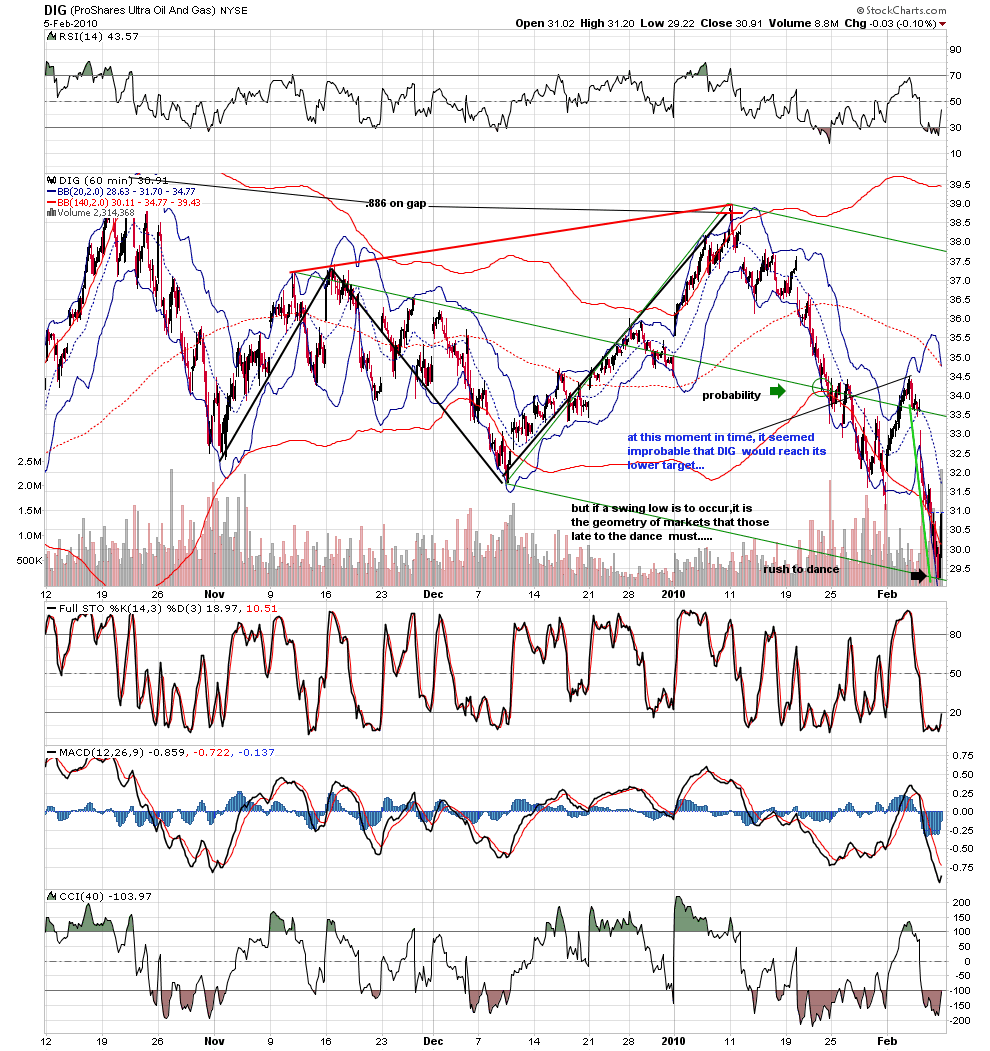
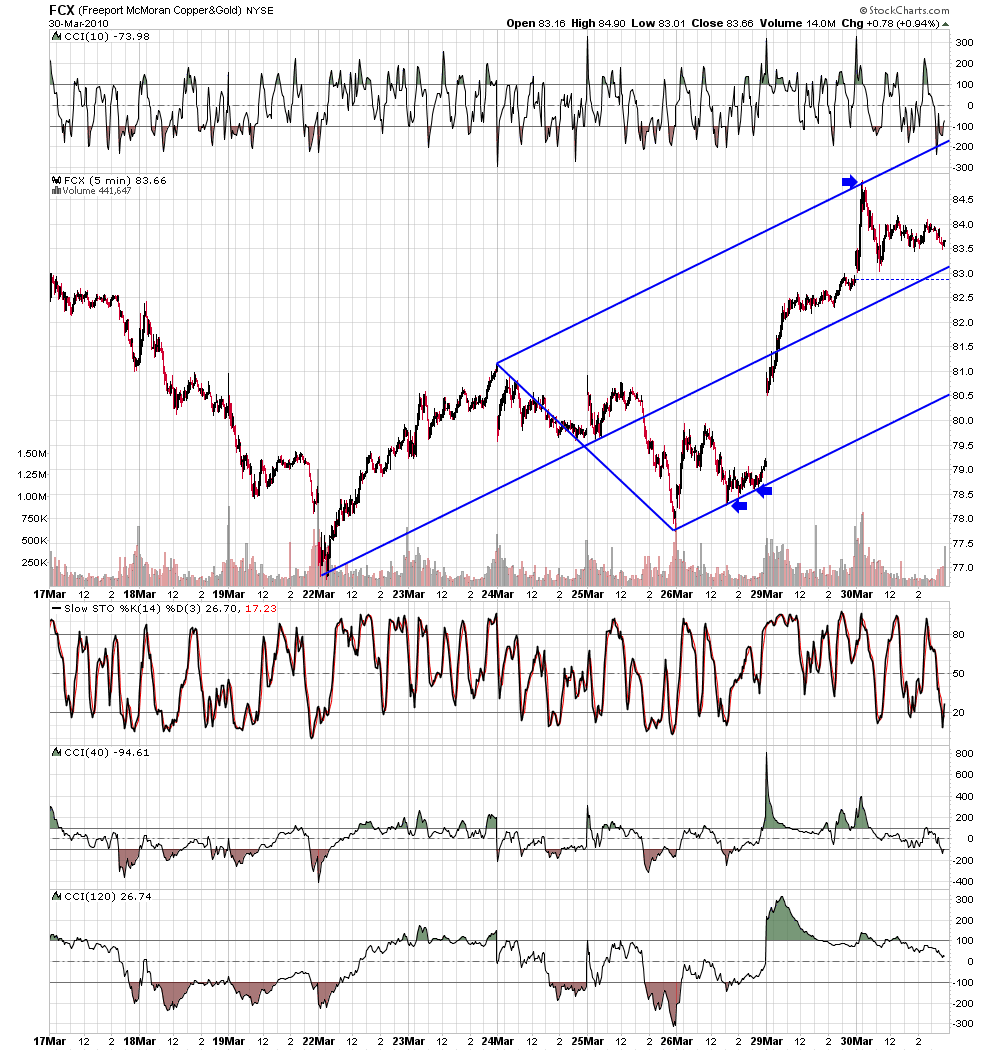
in showing the geometry of the markets.. charts are essential.here is a portion of my charts...note carefully how at the high there was no geometry to push the market higher... and note at the low how the downside targets had been hit across the board... especially note the chart of DIG... it is the essence of a bigger turn that those ''late to the dance'' must ''rush'' to their geometric target so that the whole market can turn..all of this is a lot of work.. for me it is essential.
at the moment i wrote that, the spx was at long term resistance and just over 50% of the stocks i follow were on the geometry of sell... on the morning of the 11th on the opening pop i had almost 70% of my stocks on the geometry of sell...price was at long term resistance;70% of my charted stocks were on a sell... what was missing was for the spx to set up a classic test and retest sell signal while i waited for the stragglers( e.g. COF, IBM, QCOM) to complete their geometry of sell. those conditions were met on the close jan19th.at that moment in time, based on the geometry that i trade 95% of my stocks were on sell signals with a classic setup in the spx.at that moment in time there was a technical vacuum below the market that needed resolution... and so i wrote''an exhaustive look at hundreds of stocks suggests to me we are near the years high. i am done now with target trades... i am looking for an all in''
in showing the geometry of the markets.. charts are essential.here is a portion of my charts...note carefully how at the high there was no geometry to push the market higher... and note at the low how the downside targets had been hit across the board... especially note the chart of DIG... it is the essence of a bigger turn that those ''late to the dance'' must ''rush'' to their geometric target so that the whole market can turn..all of this is a lot of work.. for me it is essential.
Click image for original size
Click image for original size
Click image for original size

Click image for original size
Click image for original size
Click image for original size

Click image for original size
Click image for original size
Click image for original size
Click image for original size
Click image for original size
Click image for original size
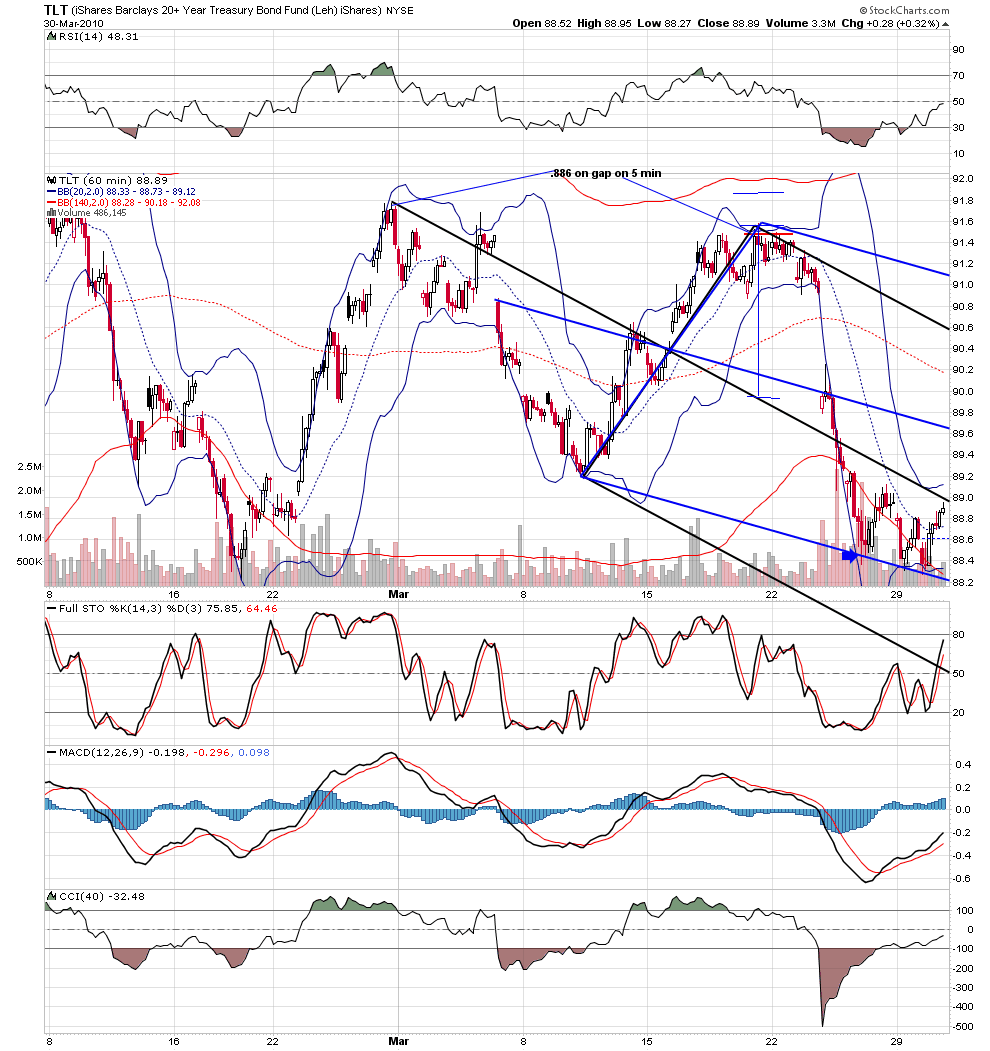
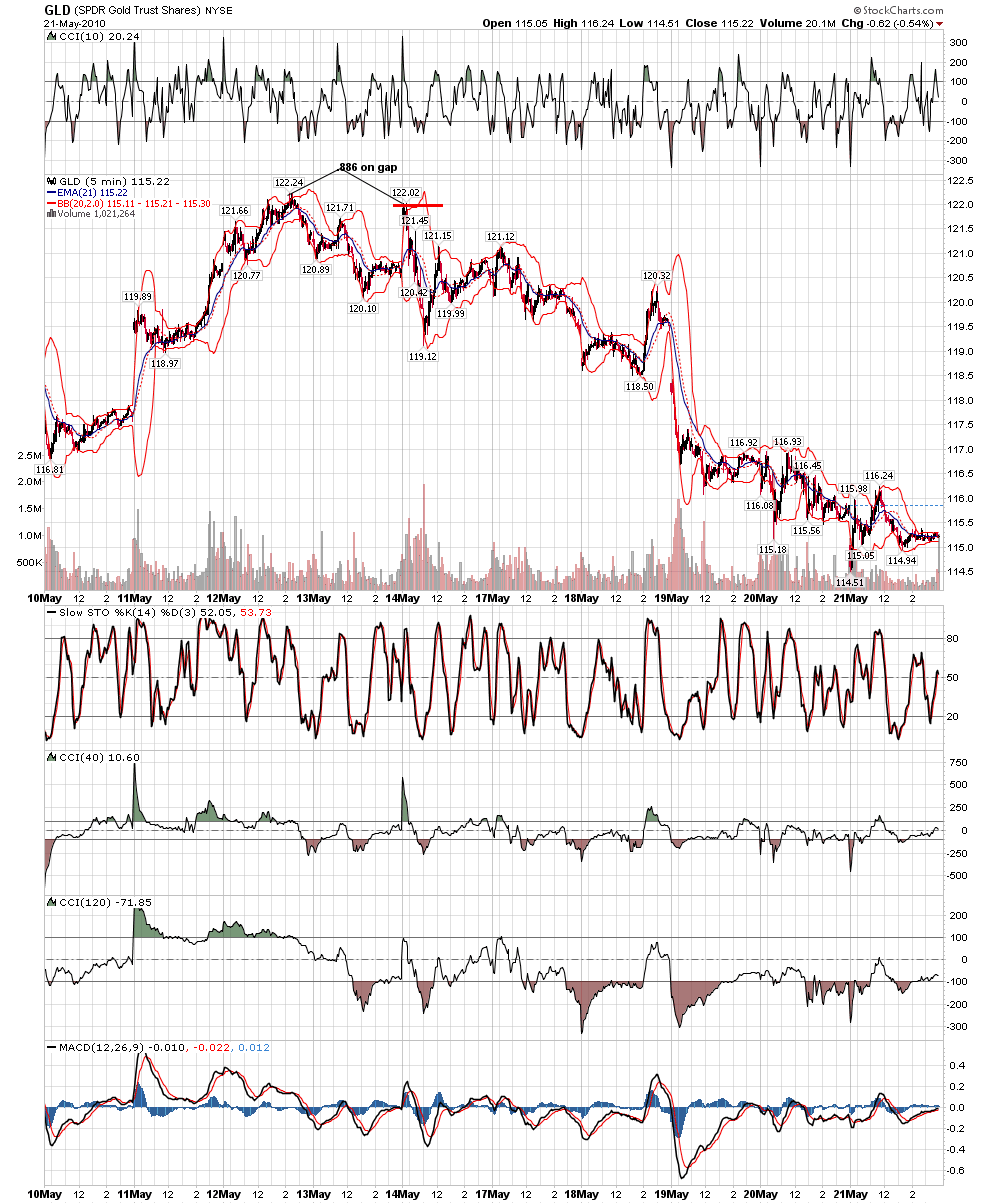
over time, these simple things serve me well.knowing when an abcd stalls at .382; knowing when the .886 occurs on opening gap on 5 minute chart; and knowing when price has spiked to a target line from a medianline set that price has respected...
Click image for original size

Click image for original size
Click image for original size
Click image for original size
some of my fellow traders questioned my sanity of my recent shorting of gold and gold stocks.( that's ok, i am not sure sitting in a dark room in front of a bank of screens punching keys can be defined as sane to begin with)
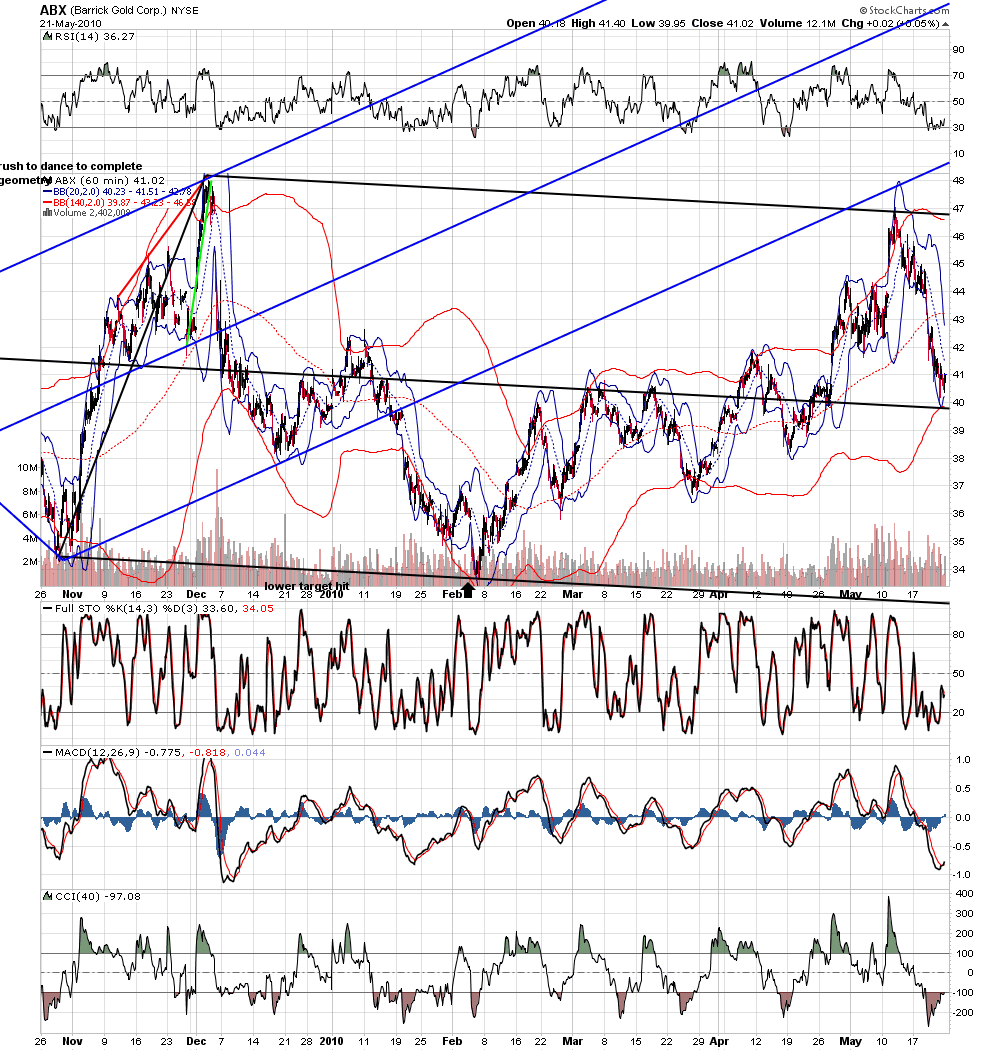
.. the geometry of a turn was there and my favorite trade signal hit...if you look back, you will see that the medianline set that i showed months ago catching the bottom in ABX was the same that caught the recent top... as in the last post, it has served me well knowing when price is at a line from a set that price has respected in the past and knowing when price is at the .886 after an opening gap on 5.
.. the geometry of a turn was there and my favorite trade signal hit...if you look back, you will see that the medianline set that i showed months ago catching the bottom in ABX was the same that caught the recent top... as in the last post, it has served me well knowing when price is at a line from a set that price has respected in the past and knowing when price is at the .886 after an opening gap on 5.
Click image for original size
Click image for original size
Click image for original size

Click image for original size
Good method roofer.
How do you select the "optimal" pivots to draw the pitchfork?
So far, the information that I have read, suggests trying different sets of pivots and identifying which one is subsequently respected by price action.
Have you improved on this?
Thanks.
cheers...
How do you select the "optimal" pivots to draw the pitchfork?
So far, the information that I have read, suggests trying different sets of pivots and identifying which one is subsequently respected by price action.
Have you improved on this?
Thanks.
cheers...
u-there are a number of traders who have spent a good amount of time and money trying to quantify the optimized pivots... i have not seen it done...i use a small group of medianline techniques to MAP what i am trading..in the context of the map, i ask does trading here makes sense based on my other tools..day in and day out the most useful thing about medianline sets for my trading is that they give me a target...so i can assess my risk...
ok;
thanks roofer.
So the basis of your setups is:
a) Fibonacci retracements/ projections OR the confluence of Fibonacci retracements/ projections. Drawing pitchfork that uses this assumed pivot as one of the pitchfork pivots.
question 1: Is that correct?
b) price turning at top or bottom pitchfork line if it has previously respected the median line
question 2: is this correct?
question 3: what happens if it has not respected the median line but has sliced through it like a knife through butter?
so far the setups I have noticed:
1) the abc or abcde retracement formation and 61.8% retracement
2) the gap to the .886 retracement (DIG)
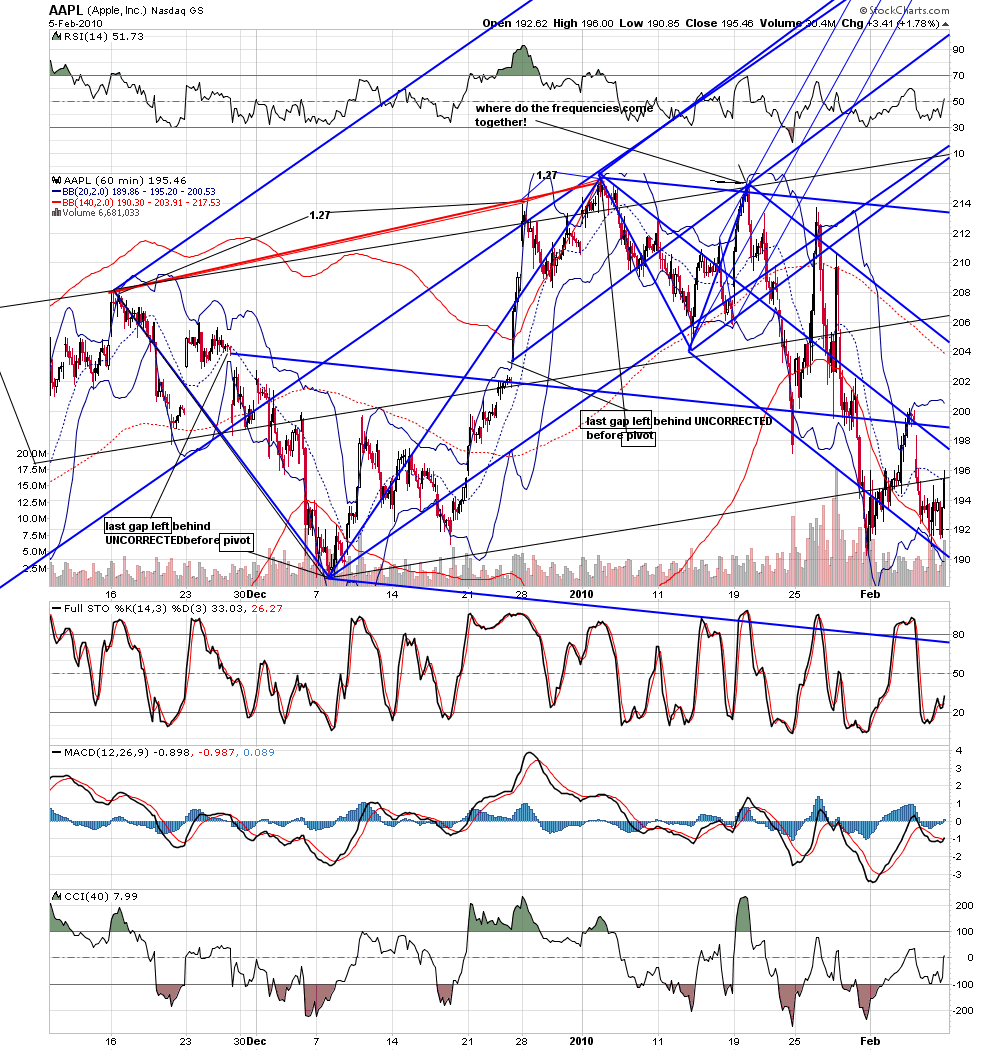
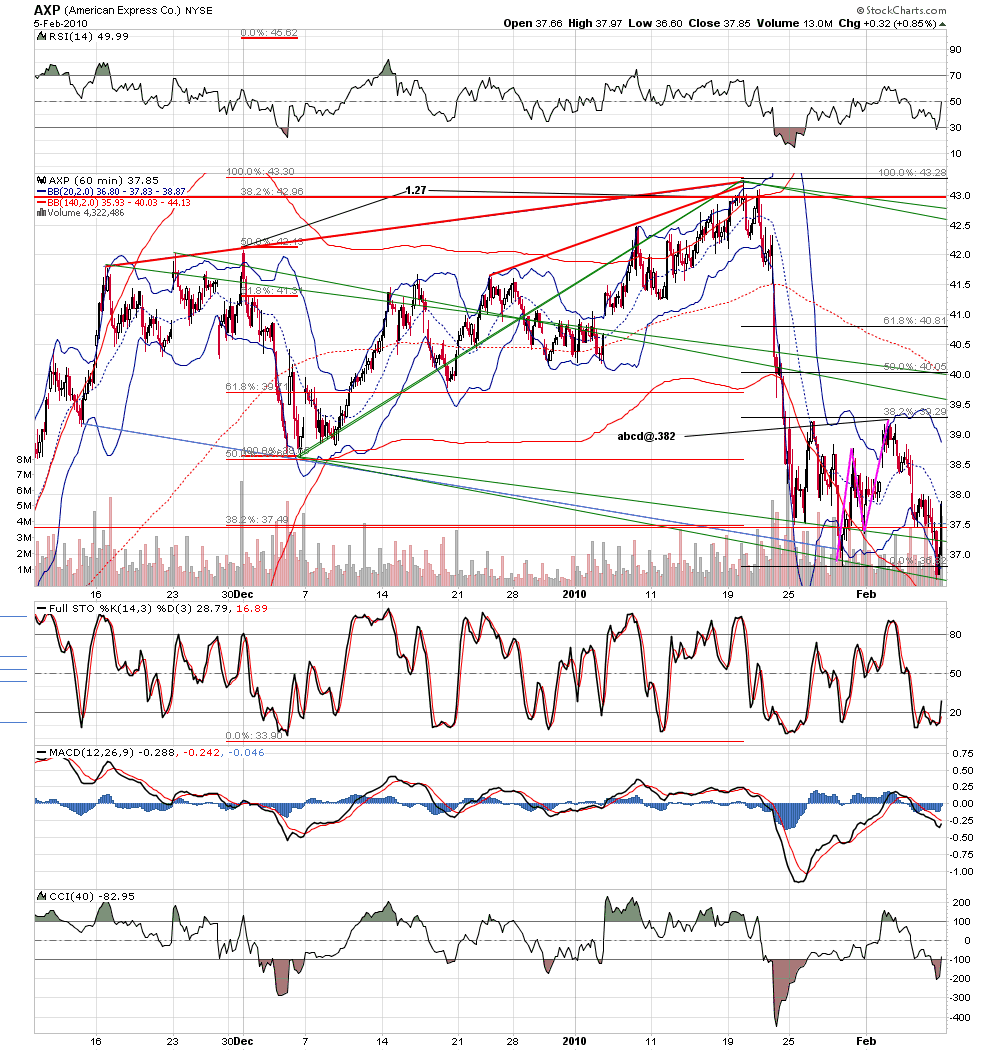
3) Fibonacci projection to the 1.27 level (AAPL, AXP, IBM, INTC,PBR)
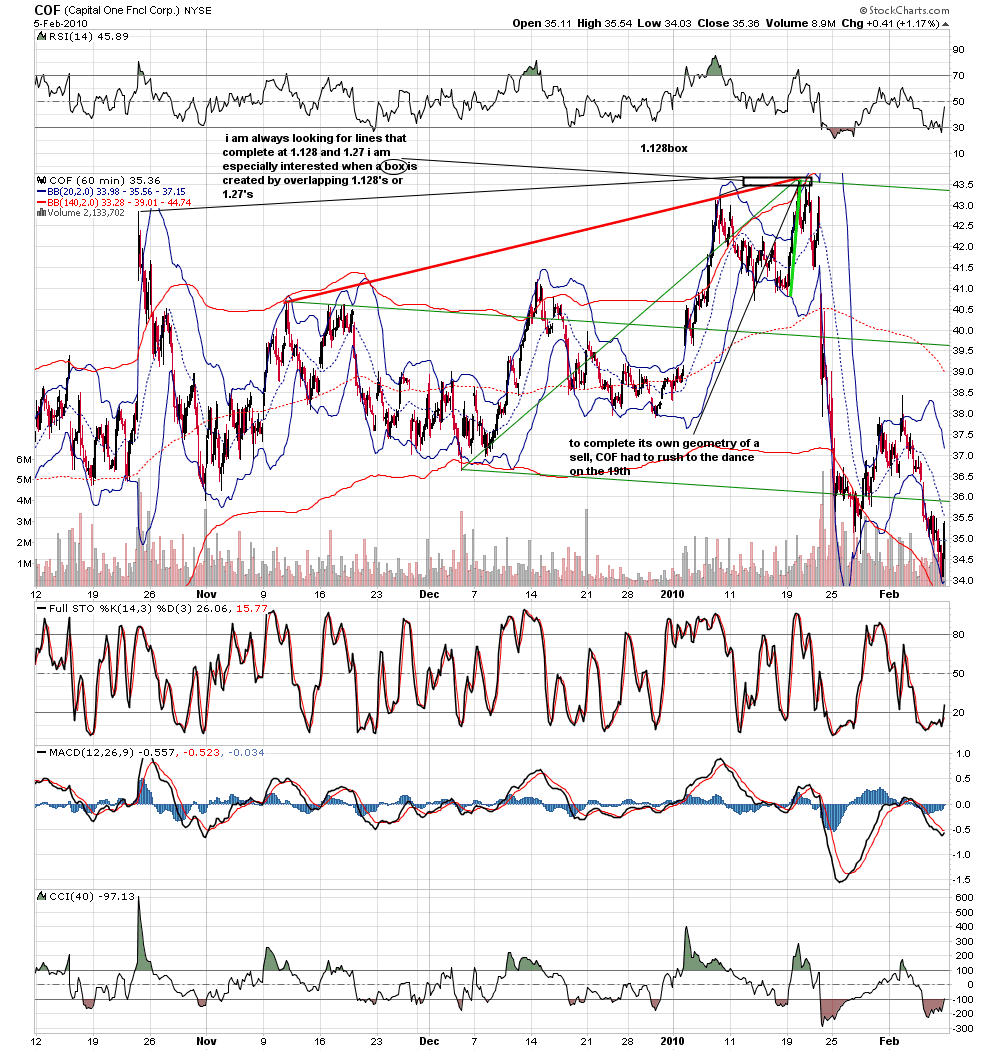
4) confluence of 1.128 and 1.27 Fibonacci projection (COF)
5) Fibonacci projection to the 1.128 level(POT, QCOM)
6) the abcde retracement (or complex flag) formation and 32.8% retracement (87% successful)(MSFT)
7) price spiking to top bottom pitchfork line from a bounce on the medianline
Question 4: do you have a list of these setups?
Question 5:
your method in 1 sentence is:
After you verify that the price bounced on the Fibonacci projection, you draw the pitchfork. And you watch price action to the median. entry is at the rejection of the fibonacci level; target is the median line. stop on the other side of pivot.
Is this method description correct? OR what is EXACTLY your method?
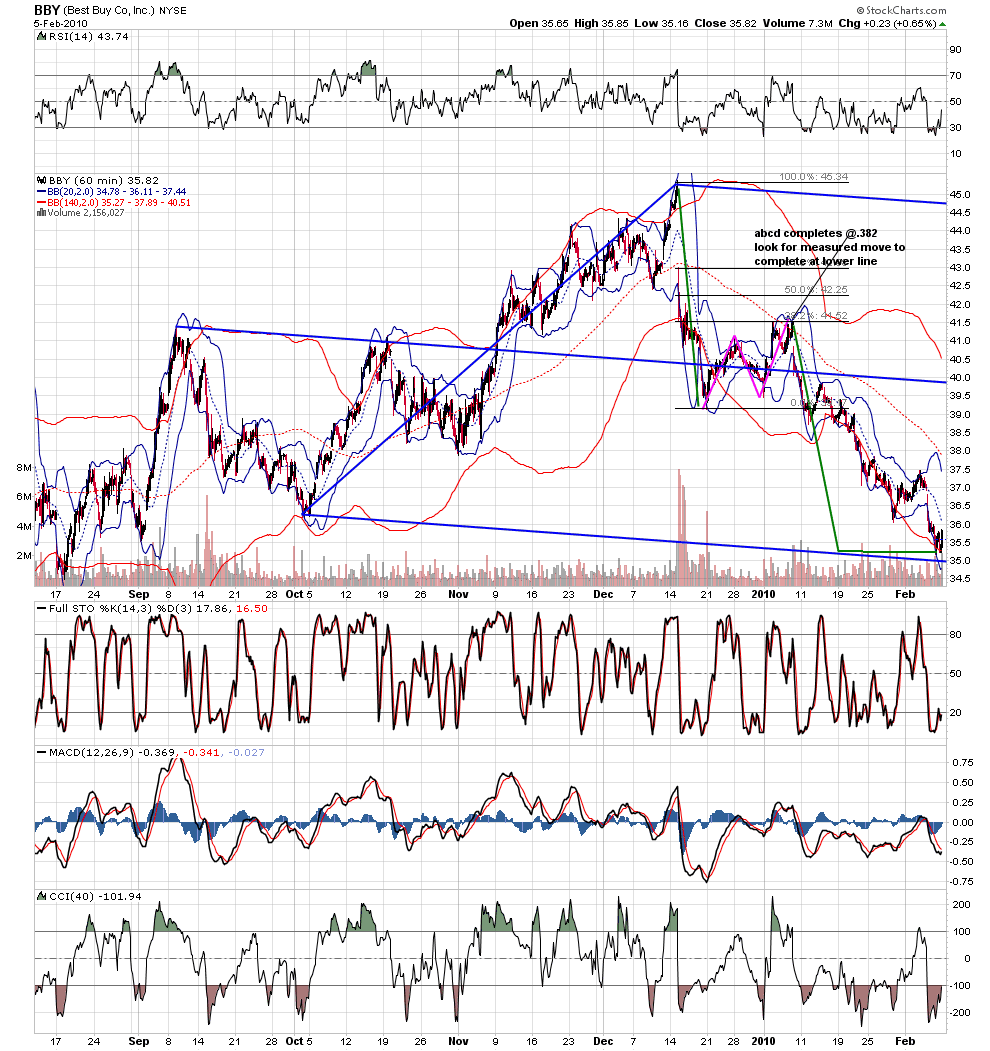
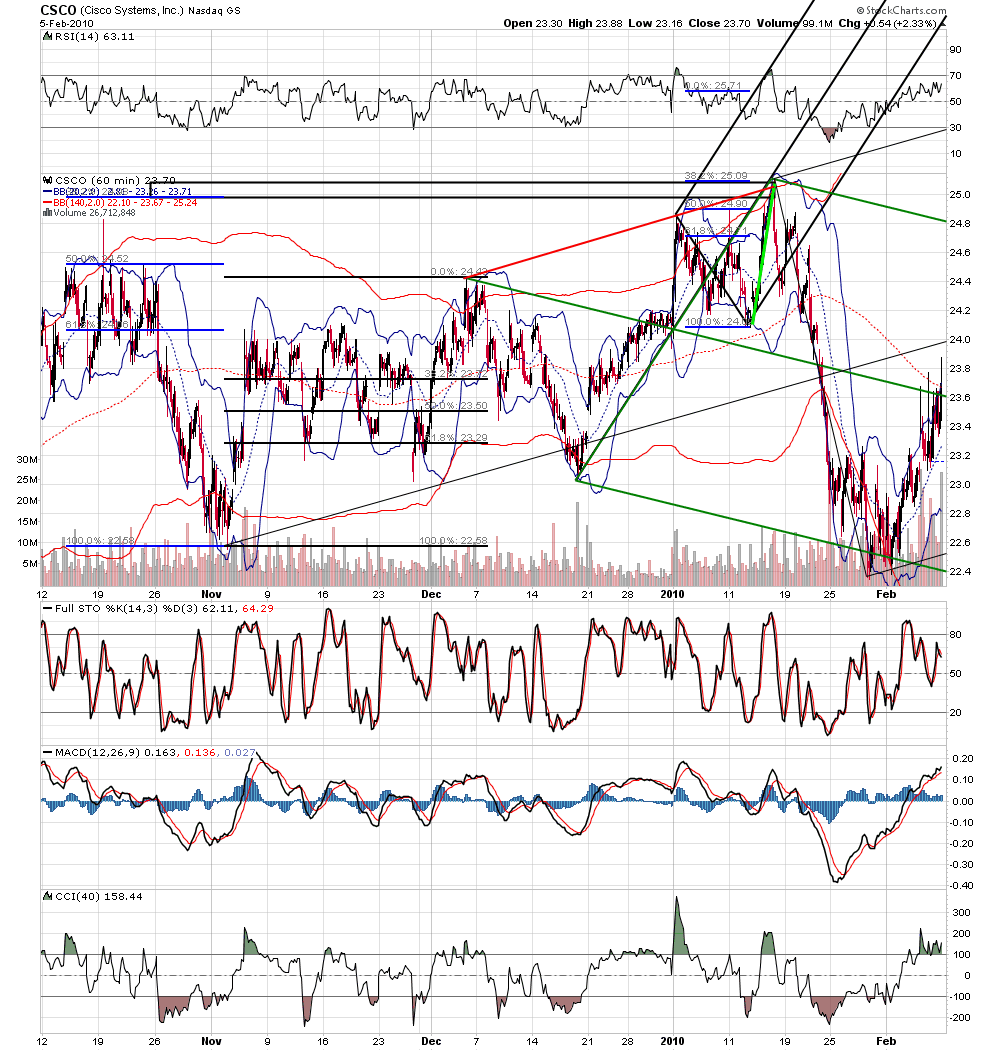
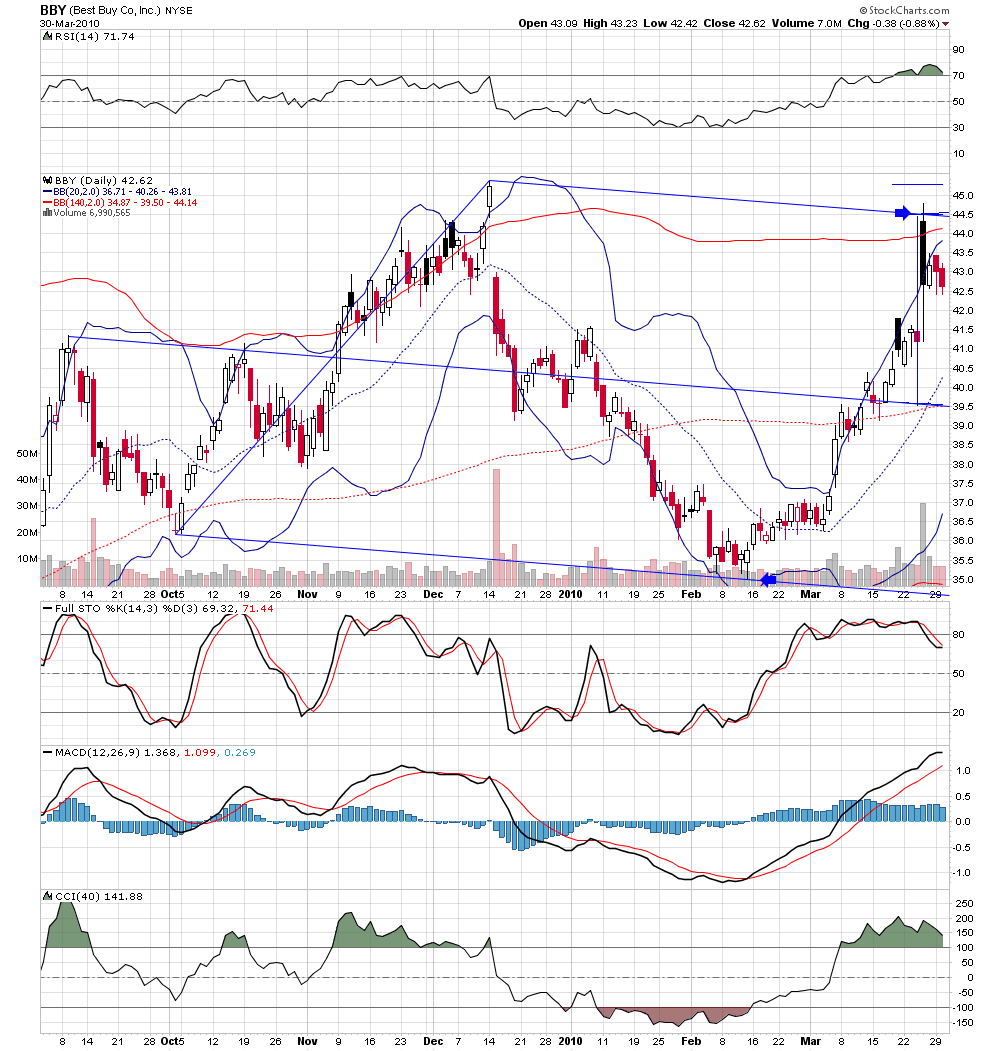
charts like INTC, HPQ BBY and CSCO : the pitchfork is drawn after the top is in place; so the method here is Drawing the pitchfork after the bounce on the Fibo and watching if the price will drop to the median line?
question 6:
what do you mean by "last gap left behind uncorrected before pivot"? (AAPL) a)Does it happen all the time?, OR b)what happens if you see that? OR c) is it Apple's kinky behaviour?
question 7:
what is a "median line handoff with test and retest" ? I suppose price is switching from previous to the next pitchfork (JPM) but you don't know that until the retest. so how do you use that? confirmation of the top and entry upon rejection of the line?
I would appreciate some text if you don't mind.
Using imagination to fill the gaps is good for liberal arts but is not good for trading.
I suppose you posted all these charts to get some questions.
cheers
thanks roofer.
So the basis of your setups is:
a) Fibonacci retracements/ projections OR the confluence of Fibonacci retracements/ projections. Drawing pitchfork that uses this assumed pivot as one of the pitchfork pivots.
question 1: Is that correct?
b) price turning at top or bottom pitchfork line if it has previously respected the median line
question 2: is this correct?
question 3: what happens if it has not respected the median line but has sliced through it like a knife through butter?
so far the setups I have noticed:
1) the abc or abcde retracement formation and 61.8% retracement
2) the gap to the .886 retracement (DIG)
3) Fibonacci projection to the 1.27 level (AAPL, AXP, IBM, INTC,PBR)
4) confluence of 1.128 and 1.27 Fibonacci projection (COF)
5) Fibonacci projection to the 1.128 level(POT, QCOM)
6) the abcde retracement (or complex flag) formation and 32.8% retracement (87% successful)(MSFT)
7) price spiking to top bottom pitchfork line from a bounce on the medianline
Question 4: do you have a list of these setups?
Question 5:
your method in 1 sentence is:
After you verify that the price bounced on the Fibonacci projection, you draw the pitchfork. And you watch price action to the median. entry is at the rejection of the fibonacci level; target is the median line. stop on the other side of pivot.
Is this method description correct? OR what is EXACTLY your method?
charts like INTC, HPQ BBY and CSCO : the pitchfork is drawn after the top is in place; so the method here is Drawing the pitchfork after the bounce on the Fibo and watching if the price will drop to the median line?
question 6:
what do you mean by "last gap left behind uncorrected before pivot"? (AAPL) a)Does it happen all the time?, OR b)what happens if you see that? OR c) is it Apple's kinky behaviour?
question 7:
what is a "median line handoff with test and retest" ? I suppose price is switching from previous to the next pitchfork (JPM) but you don't know that until the retest. so how do you use that? confirmation of the top and entry upon rejection of the line?
I would appreciate some text if you don't mind.
Using imagination to fill the gaps is good for liberal arts but is not good for trading.
I suppose you posted all these charts to get some questions.
cheers
u - it is good to see someone really looking...my intent was simply to give a glimpse of a way to look at markets.to answer all your questions would require a book, a book i will never write...briefly.. yes i have a well worn laminated list of all PREDEFINED TRADE SETUPS that i have collected thousands of charts of each ...for my swing trading i look for them to set up on 60 min charts.if across all my traders, i have 90% or greater PREDEFINED trade signals,all pointing in same direction, that is my way of knowing a bigger turn is at hand.. shorter term trades, i find my entries on 5 min.... over the last few months, i have focused on one trade setup, the .886 on gap for 95% of my trades... in a remarkable stretch, thecomputers trading the index etf's used it to turn price day after day for 13 days and in one two day period the computers used it to turn price in the indexes, more stocks than i could trade, and GLD, TLT, and USO... it is interesting to note, that it most frequently sets up in the etf's other than the spy.. i.e, those focused on only the snp, often do not see the trade set up...yesterday, monday, i knew after the firts five minutes, that i would not be trading the indexes. why? because there were no gaps on the 5 min. so i turned elsewhere... found SHORT trades in GS, CLF, USO....
thank you roofer
I will study your answers and come back with more questions
is your lists of setups a topic you are willing to disclose?
I will study your answers and come back with more questions
is your lists of setups a topic you are willing to disclose?
Emini Day Trading /
Daily Notes /
Forecast /
Economic Events /
Search /
Terms and Conditions /
Disclaimer /
Books /
Online Books /
Site Map /
Contact /
Privacy Policy /
Links /
About /
Day Trading Forum /
Investment Calculators /
Pivot Point Calculator /
Market Profile Generator /
Fibonacci Calculator /
Mailing List /
Advertise Here /
Articles /
Financial Terms /
Brokers /
Software /
Holidays /
Stock Split Calendar /
Mortgage Calculator /
Donate
Copyright © 2004-2023, MyPivots. All rights reserved.
Copyright © 2004-2023, MyPivots. All rights reserved.