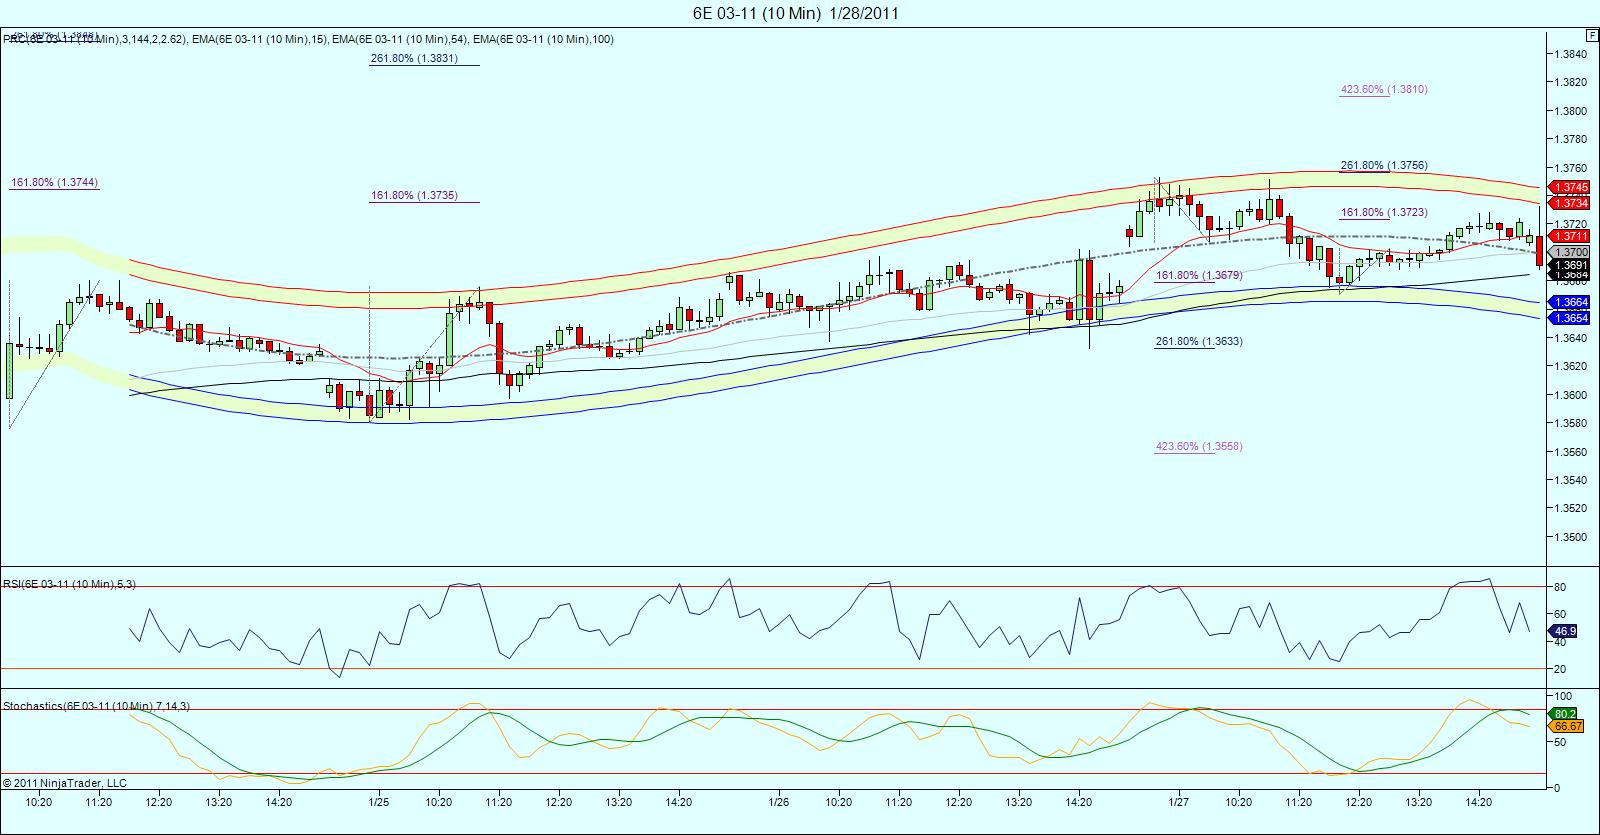
Red, sorry ,i was already asleep when you posted!.. I haven't had much time to look at it, but the daily chart indicates 1.3826 coming. Cycles are not very clear.... here's a real short term peak (10 min chart).. id be buying anywhere around the lower prc band...
KO
koolblue
Rep: 48,651
Posts: 16,032
The 1.3558 termination ratio (4.236) shown on the 8:47 post is a distinct possibility and would be a high likely hood of a good bounce if stopped out. Reason is it is the projection from the original high and usually rare to be hit , but usually indicated the end of a move!
RE
redsixspeed
Rep: 4,111
Posts: 1,711
I had 1.3591 as a major weekly support area and your chart confirmed that area .. thanks for the charts .. now check this out
your # 1.3605 + low 1.3576/2 = 1.35905 ... my # LOL
THANKS !!
your # 1.3605 + low 1.3576/2 = 1.35905 ... my # LOL
THANKS !!
RE
redsixspeed
Rep: 4,111
Posts: 1,711
Originally posted by koolblue
The 1.3558 termination ratio (4.236) shown on the 8:47 post is a distinct possibility and would be a high likely hood of a good bounce if stopped out. Reason is it is the projection from the original high and usually rare to be hit , but usually indicated the end of a move!
=====================================================================
I have that 1.3558 as a 382% of range ... also just under it I have a support at 1.3533 ... I was busy Friday and didn't see this post till
today (Sunday)... thats good confirmation of # ... now I got to add another vote up LOL .. I tried to vote it up but got the message "this vote is to old to change"