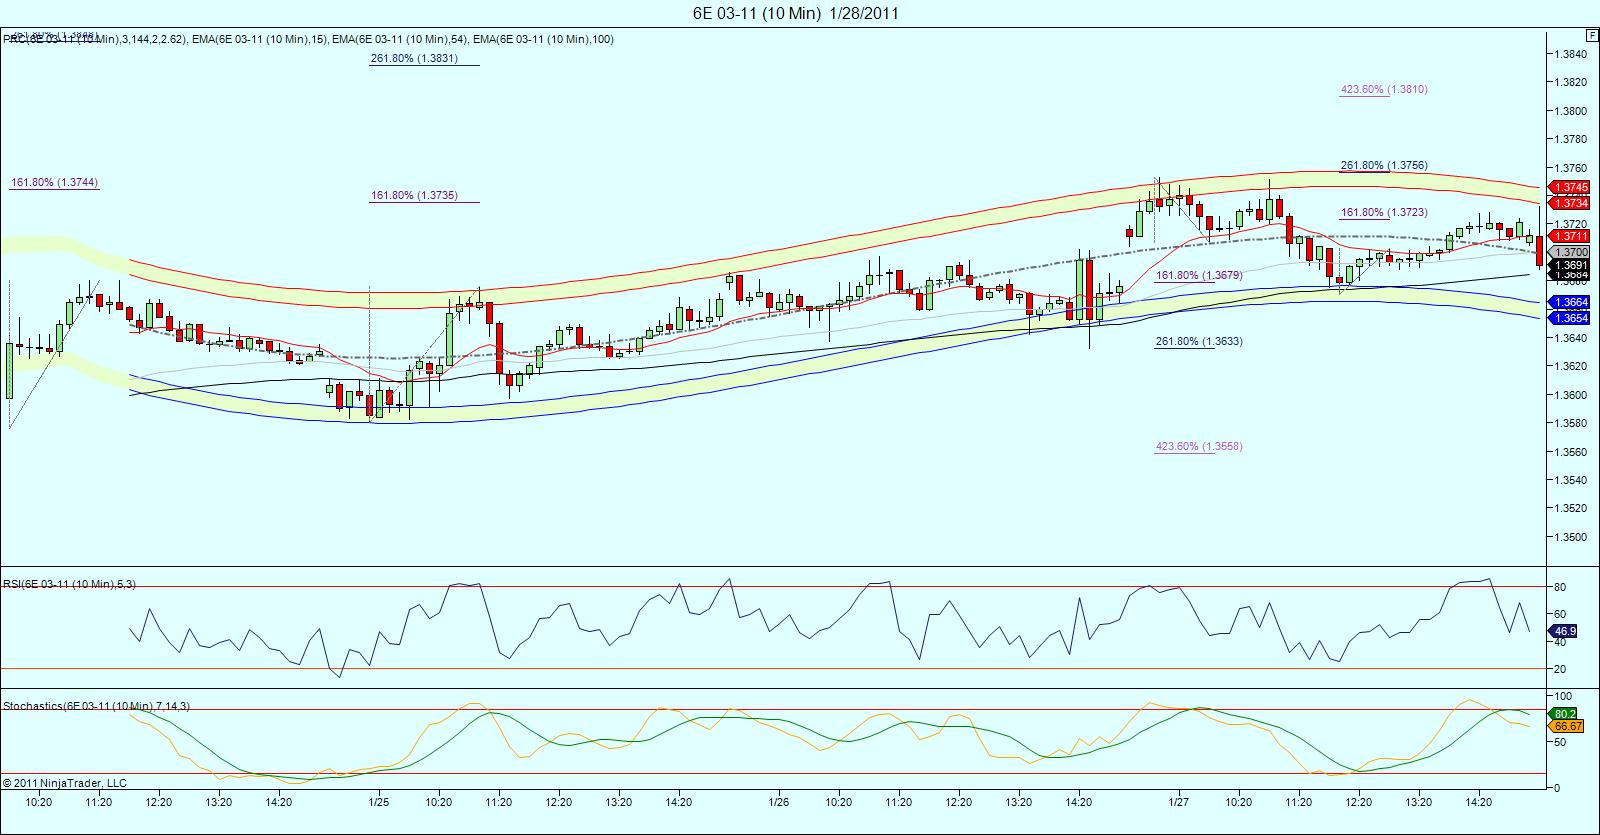
Red, sorry ,i was already asleep when you posted!.. I haven't had much time to look at it, but the daily chart indicates 1.3826 coming. Cycles are not very clear.... here's a real short term peak (10 min chart).. id be buying anywhere around the lower prc band...
RE
redsixspeed
Rep: 4,111
Posts: 1,711
Originally posted by redsixspeed
one min. bar showing accumulation
=====================================================================
distribution *
RE
redsixspeed
Rep: 4,111
Posts: 1,711
MAN !! .. "they" turned the volume up a tick or two in order to bust that 1.4874 area .. look at that volume now .. .. volume started increasing this early a.m.
RE
redsixspeed
Rep: 4,111
Posts: 1,711
If 6e gets a daily close above 1.4874 ..that is bullish imo ..
have to see how that would play out ..
LO
Lorn
Rep: 16,037
Posts: 1,406
So are you suggesting a close under it is bearish?
Originally posted by redsixspeed
If 6e gets a daily close above 1.4874 ..that is bullish imo ..
have to see how that would play out ..
RE
redsixspeed
Rep: 4,111
Posts: 1,711
it takes longer to make a top .. so a close under could mean sideways or even false breakouts .. "they" blasted that area good today ..
LO
Lorn
Rep: 16,037
Posts: 1,406
Yea I agree and the only reason I asked is at this point, in my view, one should be looking for numbers for prices to close under to broadcast bearishness because right now the bullish play doesn't need to be verified...
Cheers
Cheers
Originally posted by redsixspeed
it takes longer to make a top .. so a close under could mean sideways or even false breakouts .. "they" blasted that area good today ..