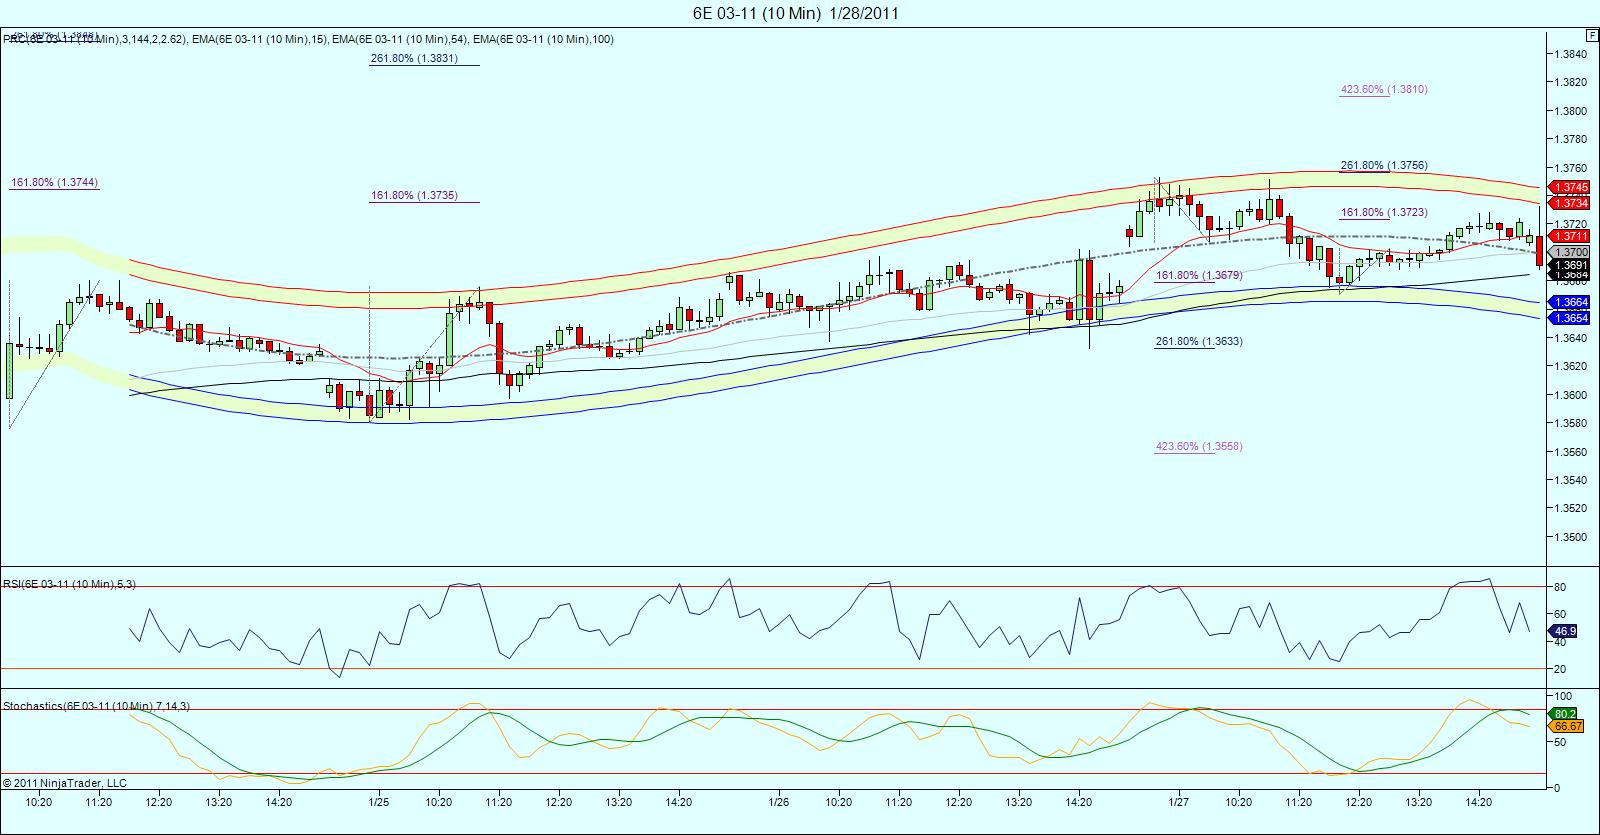
Red, sorry ,i was already asleep when you posted!.. I haven't had much time to look at it, but the daily chart indicates 1.3826 coming. Cycles are not very clear.... here's a real short term peak (10 min chart).. id be buying anywhere around the lower prc band...
RE
redsixspeed
Rep: 4,111
Posts: 1,711
Originally posted by redsixspeed
1.387 is a key # for me the next # above that is 1.412 .. I look for
the mean = 1.3995 which is @ 1.400 that some are saying is resistance.
Resistance doesn't mean reversal ..
======================================================================
1.412 ..
======================================================================
O/N session at that 1.412 .. close below that area would put
1.387 back on the radar
RE
redsixspeed
Rep: 4,111
Posts: 1,711
6e keeps flirting with that 1.412 area .. making up its mind I guess
RE
redsixspeed
Rep: 4,111
Posts: 1,711
6e closed lower than yesterday = bearish BUT it closed above
my support zone = bullish .. the support zone did not change
RE
redsixspeed
Rep: 4,111
Posts: 1,711
38.2 projection @ 1.4106 .. r2 @ 1.4109 .. equal distance move @
1.4110 and a mid point # @ 1.4112 .. I'am pulling for the mid #
RE
redsixspeed
Rep: 4,111
Posts: 1,711
key prior low 1.4035 .. bullish candle pattern low 1.4026 ..
1.4035 + 1.4026/2 = 1.4030 ..
to say it another way, the boyz hit it 4 ticks early ..
1.4035 + 1.4026/2 = 1.4030 ..
to say it another way, the boyz hit it 4 ticks early ..