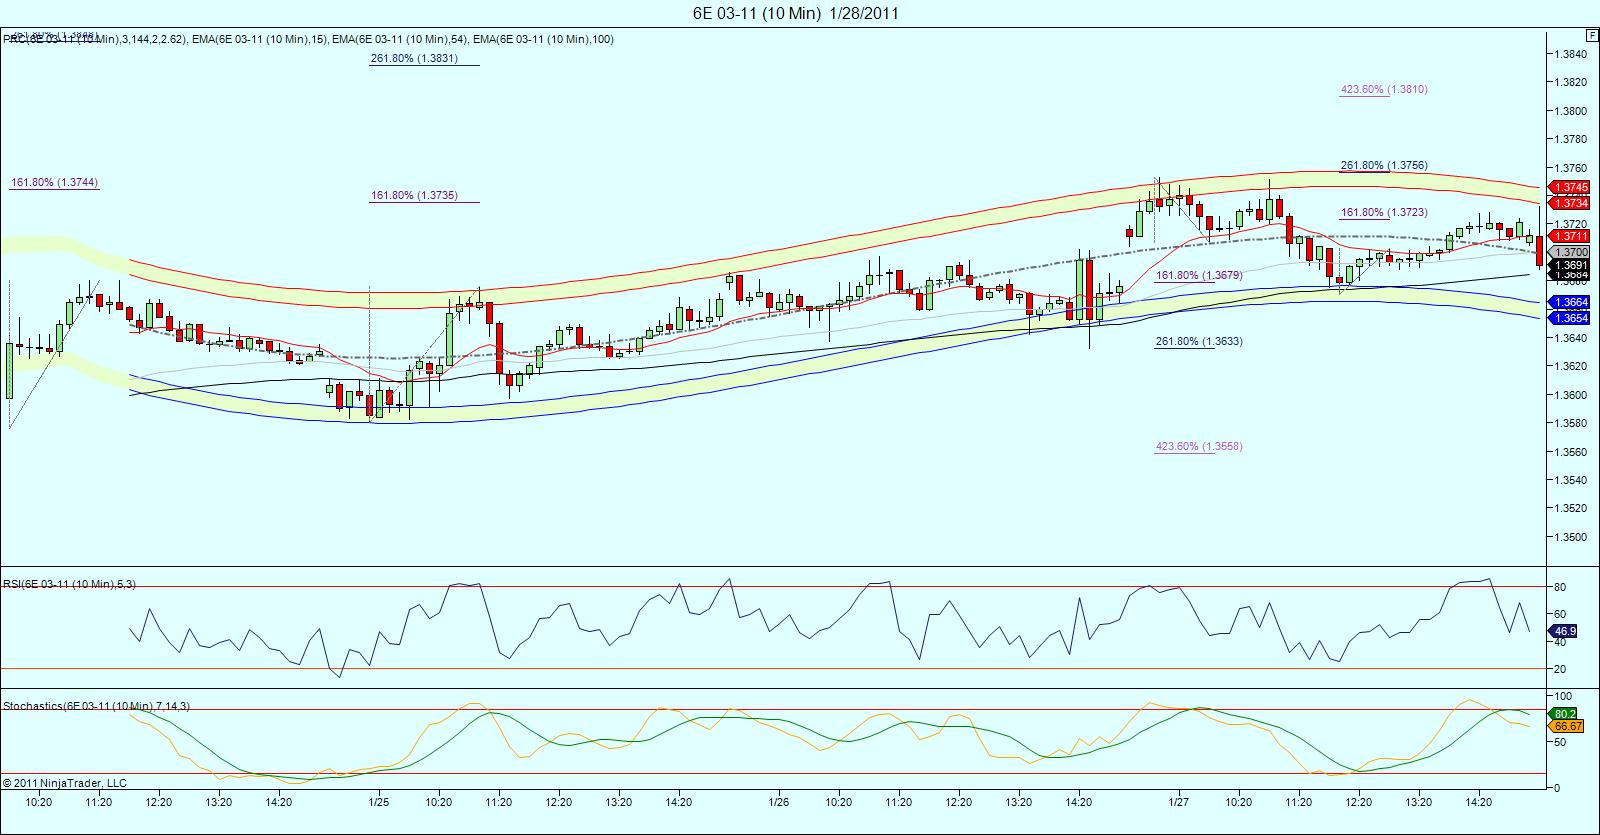
Red, sorry ,i was already asleep when you posted!.. I haven't had much time to look at it, but the daily chart indicates 1.3826 coming. Cycles are not very clear.... here's a real short term peak (10 min chart).. id be buying anywhere around the lower prc band...
 😎
KO
koolblue
Rep: 48,651
Posts: 16,032
CH
CharterJoe
Rep: 4,475
Posts: 2,352
found a bit of support on the bb 14,2 mid line 1min....looking for a new short term high and then a 3575 pull back.
RE
redsixspeed
Rep: 4,111
Posts: 1,711
Originally posted by koolblue
1.3583 would be a sell scalp imho!
yes I hoping 1.3569 will catch it ..
CH
CharterJoe
Rep: 4,475
Posts: 2,352
3600 has been a good trade able number all day in the spot market. Just good for another 15pips. First 30min mid line BB touch since the news release this morning. sorry for the after the fact...trade comes first. Spreads fixing to get wide thats it for me have a great weekend all.
RE
redsixspeed
Rep: 4,111
Posts: 1,711
Originally posted by redsixspeed\
Originally posted by koolblue
1.3583 would be a sell scalp imho!yes I hoping 1.3569 will catch it ..
===================================================================
bouncing off that 1.3569 ... need more momo
RE
redsixspeed
Rep: 4,111
Posts: 1,711
If 6e don't tank and take out 1.3533 that is bullish .. if it gets to 1.3622 that may smack it back down
RE
redsixspeed
Rep: 4,111
Posts: 1,711
Originally posted by redsixspeed
If 6e don't tank and take out 1.3533 that is bullish .. if it gets to 1.3622 that may smack it back down
=================================================================== ok here is what this post means .. the two areas I'am watching 1.3533 + 1.3622/2 = 1.3578 mean .. 6e closed above .. for me that = bullish ... starting Sunday night I'll see how it plays out
DA
day trading
Rep: 39,586
Posts: 6,371
Originally posted by CharterJoe
does any one know how to post charts from oanda platform?
You can just use any screen capture software and then post the image.