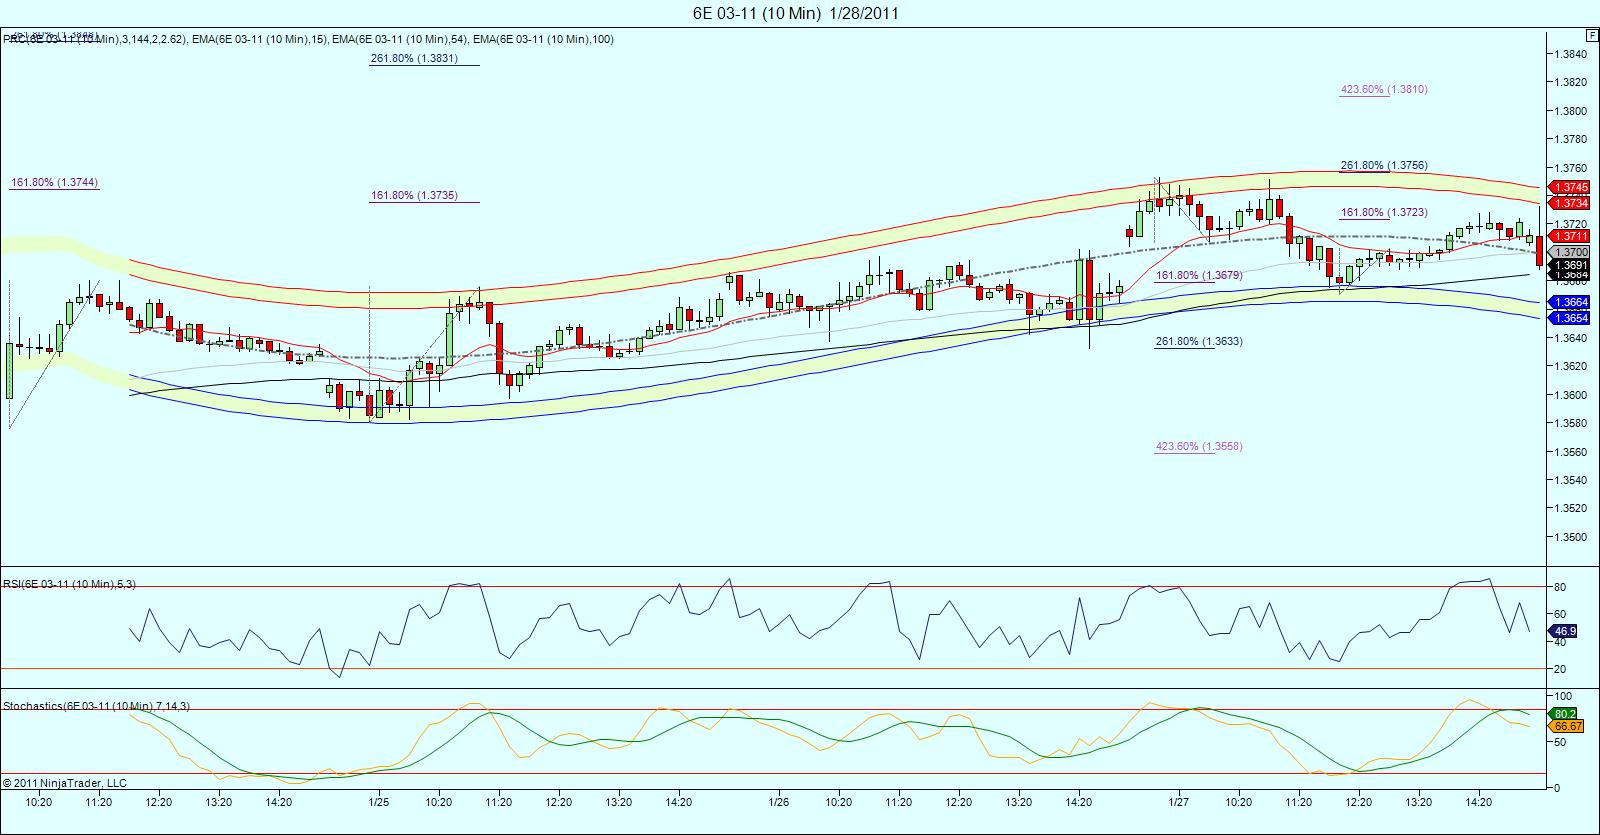
Red, sorry ,i was already asleep when you posted!.. I haven't had much time to look at it, but the daily chart indicates 1.3826 coming. Cycles are not very clear.... here's a real short term peak (10 min chart).. id be buying anywhere around the lower prc band...
- Page(s):
- 1
- 2
- 3
- 4
- 5
- 6
- 7
- 8
- 9
- 10
- 11
- 12
- 13
- 14
- 15
- 16
- 17
- 18
- 19
- 20
- 21
- 22
- 23
- 24
- 25
- 26
- 27
- 28
- 29
- 30
- 31
- 32
- 33
- 34
- 35
- 36
- 37
- 38
- 39
- 40
- 41
- 42
- 43
- 44
- 45
- 46
- 47
- 48
- 49
- 50
- 51
- 52
- 53
- 54
- 55
- 56
NI
NickP
Rep: 7,237
Posts: 771
koolblue, what other time frames other than 30 min do you look at when trading 6e ? thanks !
Originally posted by koolblue
still believe we will see 1.4146 print ,later
RE
redsixspeed
Rep: 4,111
Posts: 1,711
That sell zone was tough today .. 6e was between a rock and a hard place
as the old folks around here say ..
RE
redsixspeed
Rep: 4,111
Posts: 1,711
That pattern ^^ gave a small move back up .. the volume on the second candle was indicating more down to come .. for a "last engulf" pattern, the volume on the second candle should be less than the first candle ..
CH
CharterJoe
Rep: 4,475
Posts: 2,352
fwiw red I look for the bar the same color of the new trend, and a strong close or at least a micro trend break.
CH
CharterJoe
Rep: 4,475
Posts: 2,352
Two strong uptrends in eu this morning approaching the large down trend line it tested at 5:00 this morning. Lots of overlapping this morning.
CH
CharterJoe
Rep: 4,475
Posts: 2,352
Uptrend line since 10am has been violated but with sideways action which tells me its not a real trend break...I am long 4106