Hi Jim,
Thanks for opening this Forum to your students and giving us an opportunity to show our charts and share our ideas.
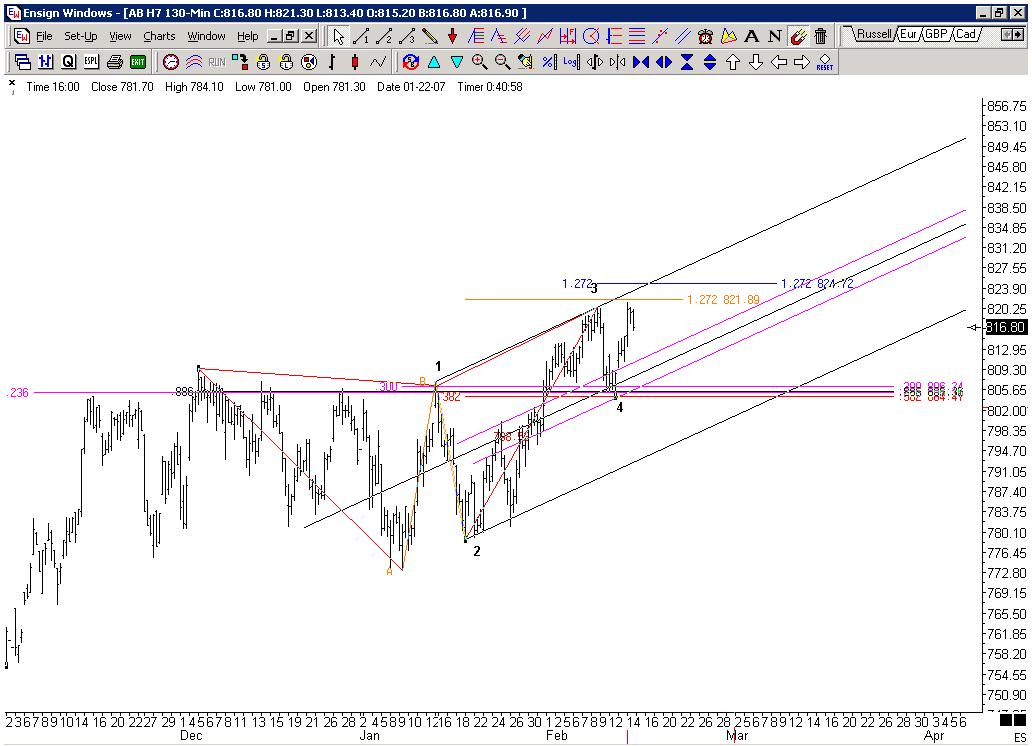
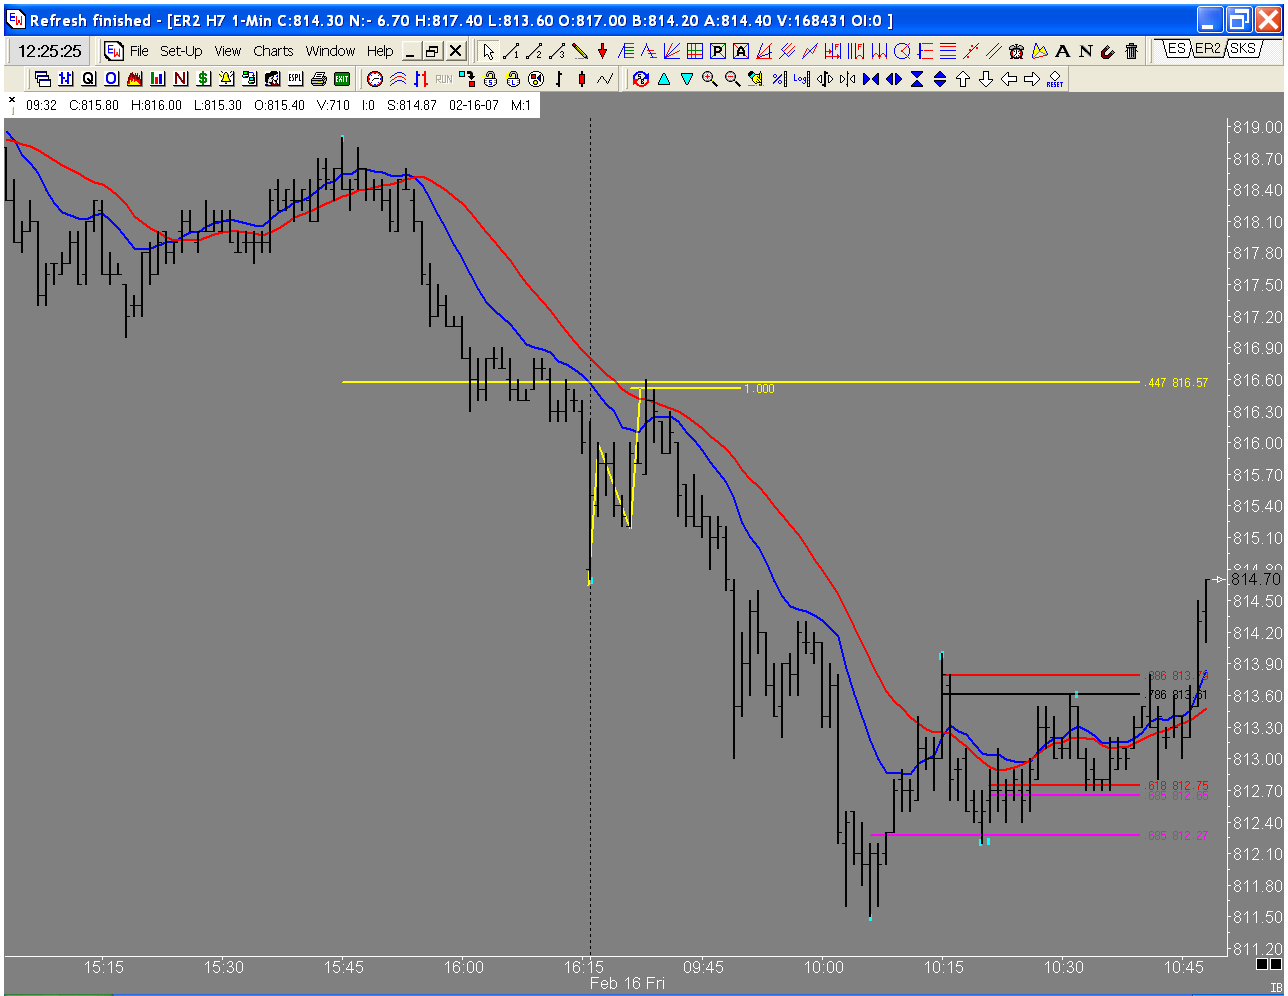
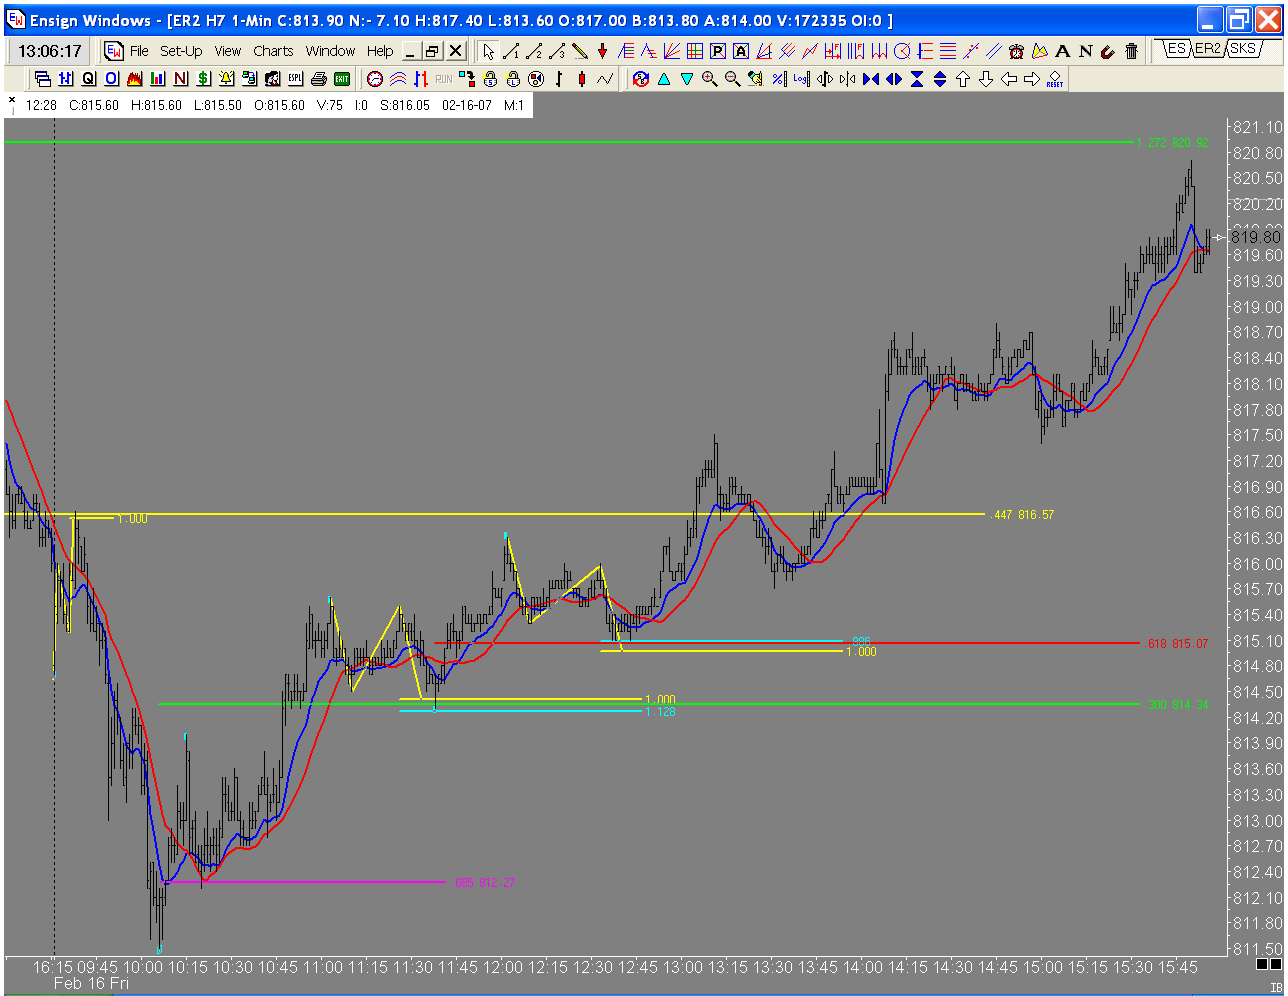
Here is a chart of todays ABCD's in the russell. I will post a context chart later. Today was one of those days where the market changes direction on Jim's unique Fib numbers, Had you been trading with standard fib numbers you may not have noticed these PTA's. Is it me or is .564 becomming more and more prevalent?
JI
jimkane
Rep: 3,058
Posts: 33,089
quote:
Originally posted by mreiserer
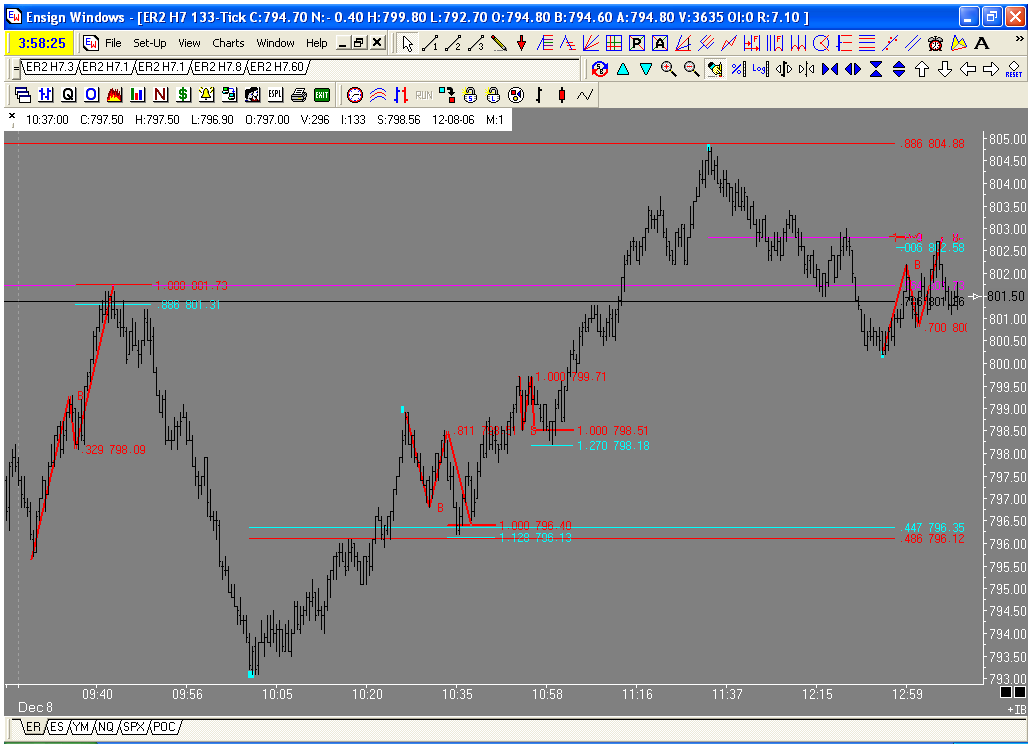
Jim, after all would you have considered this a valid wave 4 bounce setup?
M,
Yes, it is pretty close. The main aspects of a 'wave 4 bounce setup' is that there is an obvious trend and an external 5-point pattern sets up to call the end of the trend. Here point B (your point 1) is almost even with X, so the 5-pointers may be thrown off a bit, but it isn't a deal killer. If B was higher than X, no setup.
Next, I prefer at least a 1.272 of the XA leg, because the 5-pointers will start to salivate, especially with a .786 B point, because they all see the Butterfly. They short it, it goes, as it does here, to the usual top of 'wave 2' (the B point, and watch the .382's and .447's), and then takes off.
Here's what I see all the time, though. I see two drops. Many times the first drop is the 'wave 4' of the CD leg, and then it goes up for the final 'wave 5', and then down again, many times, it seems, right to the same spot. Notice the 1, 2, 3, and 4 potential wave count in the CD leg here.
So, it may do 'wave 5' in the CD leg, and then a bigger 'wave 4' and 'wave 5', and then a larger correction. This layout has so many nuances and is so useful it is worthy of another book, and if I were still going to write, this would be next, or right after the next 4-5 newer ABCD patterns.
I didn't write this up because I decided I really didn't want to reveal any more about it, like the other ABCD's. I think this is really great stuff, and I hope this helps give everyone more details on it. I covered this a bit in the members' commentary (now in the archive), too.
MR
mreiserer
Rep: 110
Posts: 2,220
Thanks so much for the explanation Jim. Truly another great discovery of yours.
DU
Duane
Rep: 100
Posts: 1,095
Still think Geo could be right. Inside day with retracement to .886
on the IWM chart. Cannot upload chart.
JI
jimkane
Rep: 3,058
Posts: 33,089
Oh, I agree, it isn't over yet. Got to see what it does from here. Futures are down a bit, but there is a lot of dark before the dawn.
DU
Duane
Rep: 100
Posts: 1,095
“After spending many years in Wall Street and after making and losing millions of dollars I want to tell you this: It never was my thinking that made the big money for me. It always was my sitting.” Quote from JL
JI
jimkane
Rep: 3,058
Posts: 33,089
Funny you should mention that. I am working on a free article for the website, my top 10 or 20 quotes from the book, and a reiteration of how I have read that book on average once a month since I started trading, now over 100 times, and why.
DU
Duane
Rep: 100
Posts: 1,095
Wow Jim, I can't wait to read that article!! What a perfect way to end the week,a nice day long trend, a Klassic Kane Trading setup!!
Oops can't post chart, getting script error again. I know you all saw it anyway!! Did you see the .618 4PTCP on the 1min?
DU
Duane
Rep: 100
Posts: 1,095
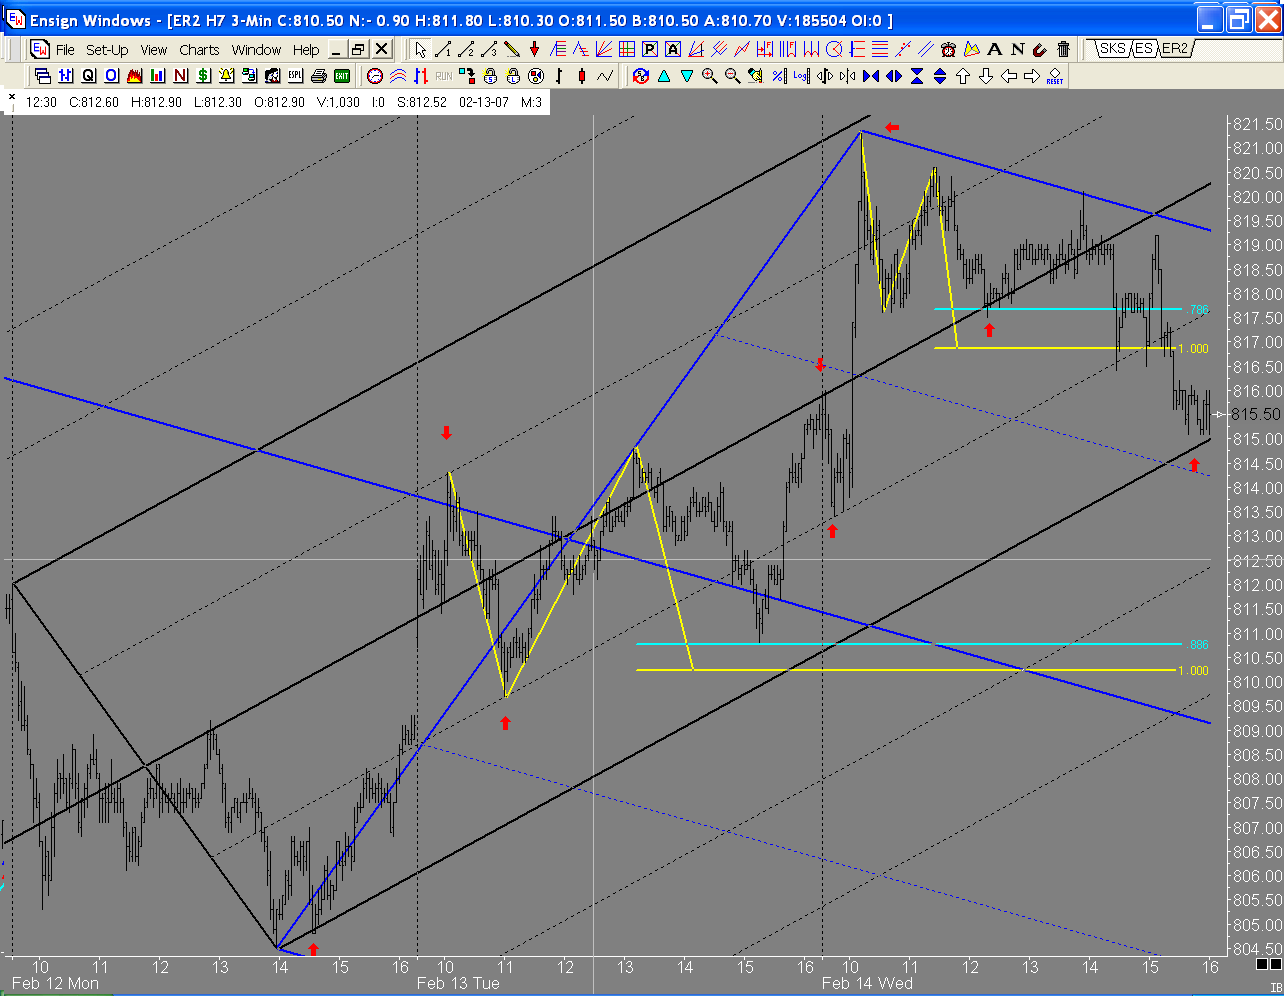
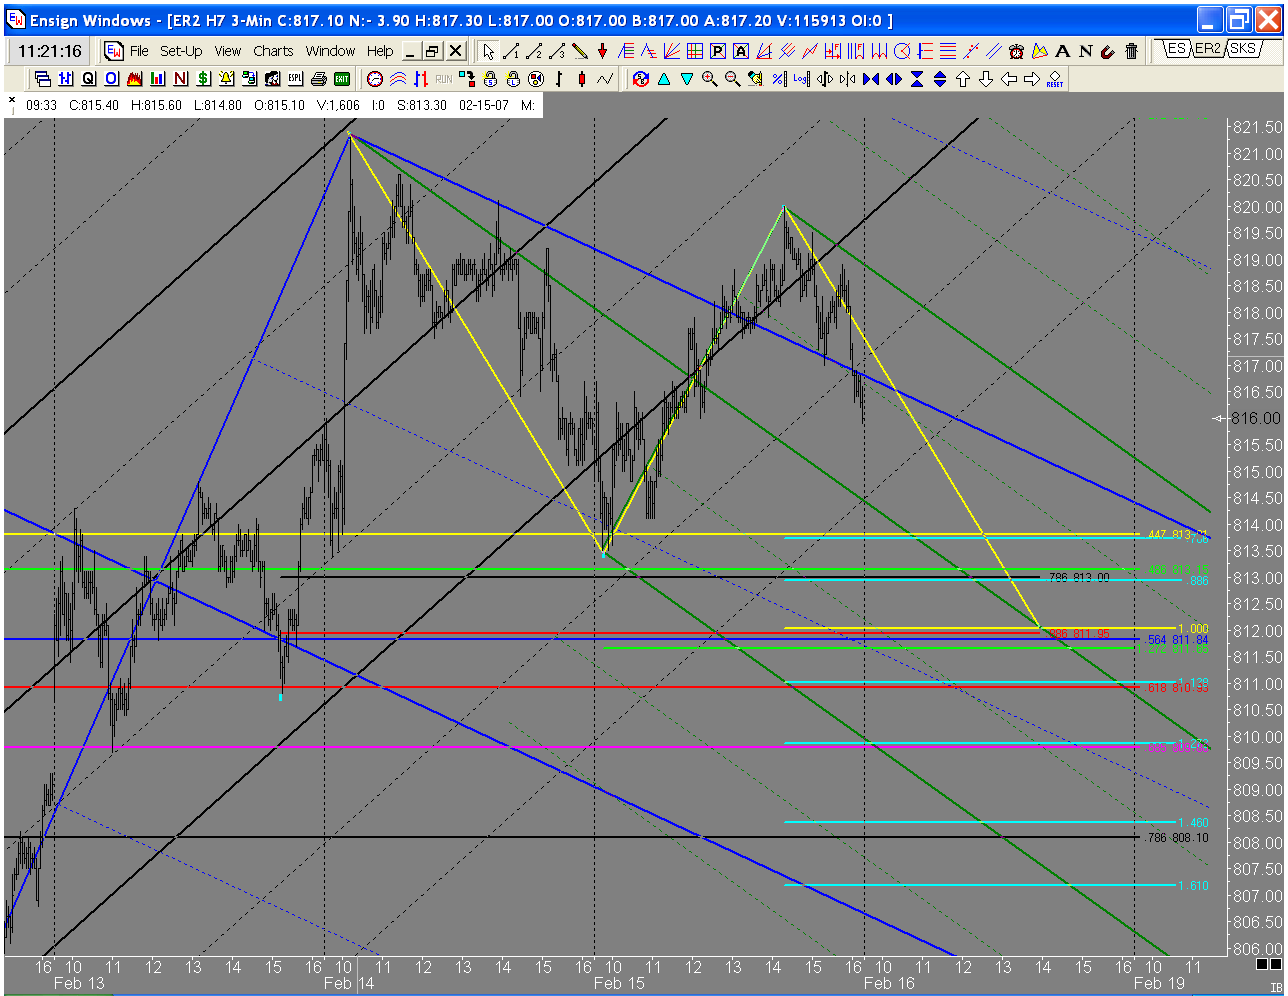
Here is a work up of charts from Jims latest commentary. On thur night we all saw the makings of an possible ABCD, I put on a couple of fib levels to see what the possible PTA's for the next day might be.
If this ABCD is to occur I want to be short on the open to pick up a couple of points. I look for a pre-market entry on the tick chart. I am looking for an ABCD or a countinuation pattern to get me in.
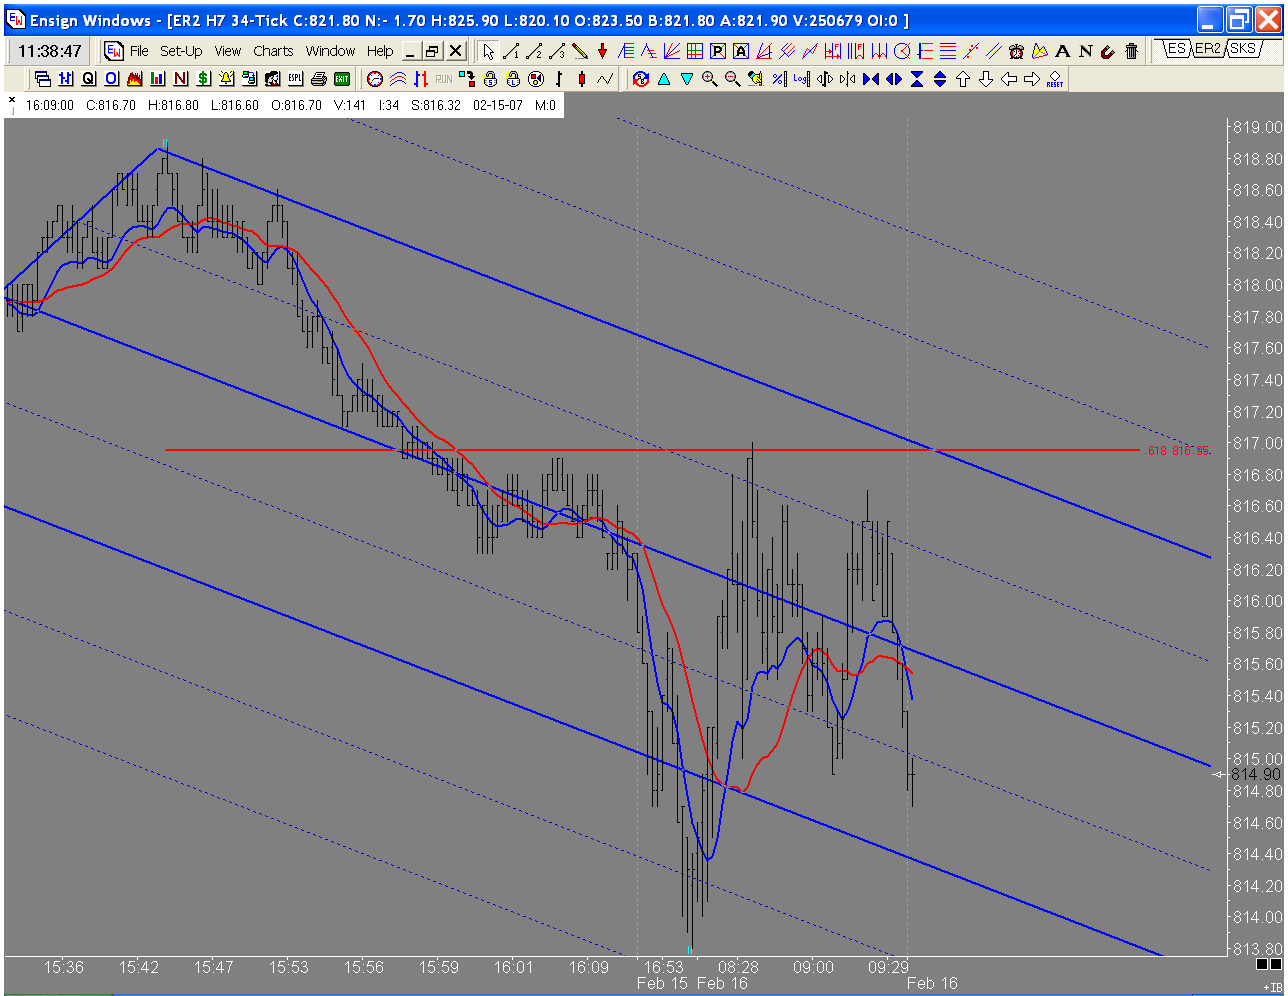
The market is down overnight, then retraces to .618, starts to coil but no discernable 4PCP entry. At this point I am thinking the market will get away from me, but no signal no trade, I have learned this the hard way, trust me. I switch to the 1 min chart when the market open and look an entry.
The trading Gods gave me an entry, an ABCD at a .447 retracement. Two bars latter I am in. As the market descends into the fib levels I look for a place to take profits and reverse. The market reacts to the .786 ABCD level but no entry signal. THe market then hits the next cluster and thrusts up sharply with a clear impulse pattern on the tick chart. I am stopped out of the short position and I am looking to to get long. The market retraces to the .685 the MA cross and I am in. Target, 1.27 extention of the CD leg. Market gives multiple entry signal on the 1min.
Kane Trading at its finest, It does not get better than this!!