MyPivots
Sign In
DU
Duane
Rep: 100
Posts: 1,095
Hi Jim,

Thanks for opening this Forum to your students and giving us an opportunity to show our charts and share our ideas.

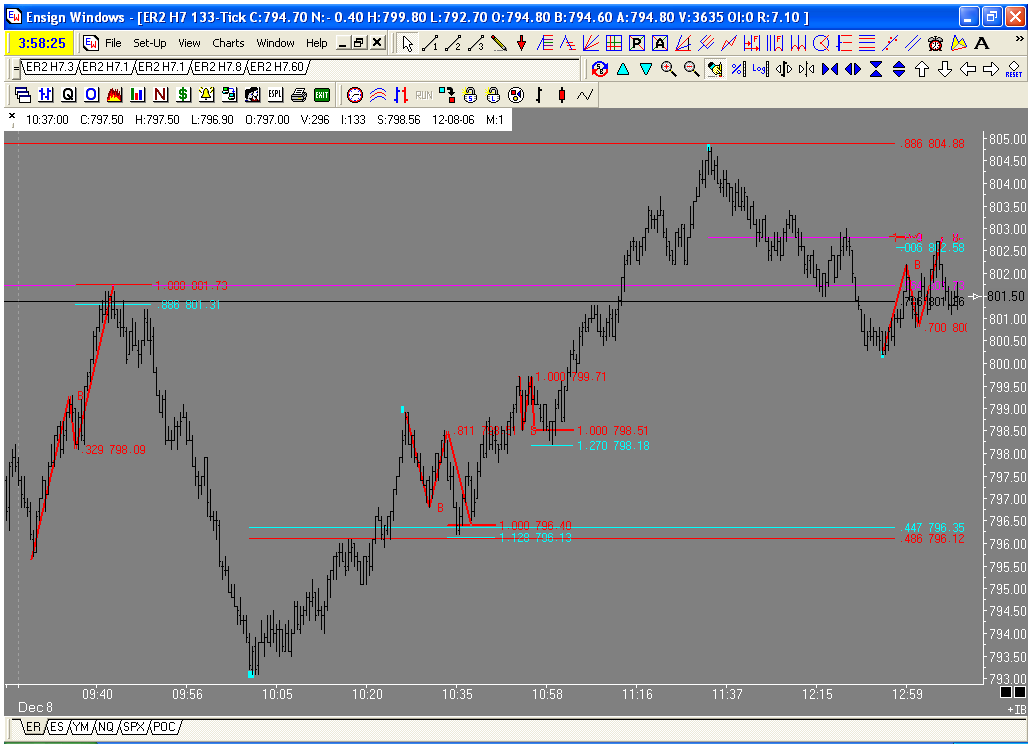
Here is a chart of todays ABCD's in the russell. I will post a context chart later. Today was one of those days where the market changes direction on Jim's unique Fib numbers, Had you been trading with standard fib numbers you may not have noticed these PTA's. Is it me or is .564 becomming more and more prevalent?

Click image for original size
No Description Entered
JI
jimkane
Rep: 3,058
Posts: 33,089
You all know why this is a critical spot right here, right? If this gives way, watch out below.
JI
jimkane
Rep: 3,058
Posts: 33,089
Sometimes this stuff just amazes me beyond my ability to comprehend...
MR
mreiserer
Rep: 110
Posts: 2,220
There are a few things I see before the gap up that are similar:
both produced ABCDs that terminated at the 1.902(there was also an .886 right there in both cases), the reaction from that was a .685 and they both closed near the .382 from the top of that 1.902 ABCD.
Maybe just a shot in the dark here....
JI
jimkane
Rep: 3,058
Posts: 33,089
M,

Think pattern and layout, and how things reacted, and not numbers. Every new pattern started as someone seeing something, a structure, that no one else saw before. I'm not saying this will become a new, known pattern, but it is a 'layout' I've seen before, with the same results as we saw this time.
DU
Duane
Rep: 100
Posts: 1,095
Warning line holding
DU
Duane
Rep: 100
Posts: 1,095
The double bottom pattern? will post what I see latter.


quote:
Originally posted by jimkane

Yes, it is something I see frequently. I also see the previous highs and lows being used, too. But I have to be careful not to get too much on my charts, or I'll get analysis paralysis.

Did you notice it followed the pattern I hinted at above? I'm surprised I didn't get any comments on that. I'm not going to describe this, you guys all need to do the work to try to figure this out, if you think it's worth it.

JI
jimkane
Rep: 3,058
Posts: 33,089
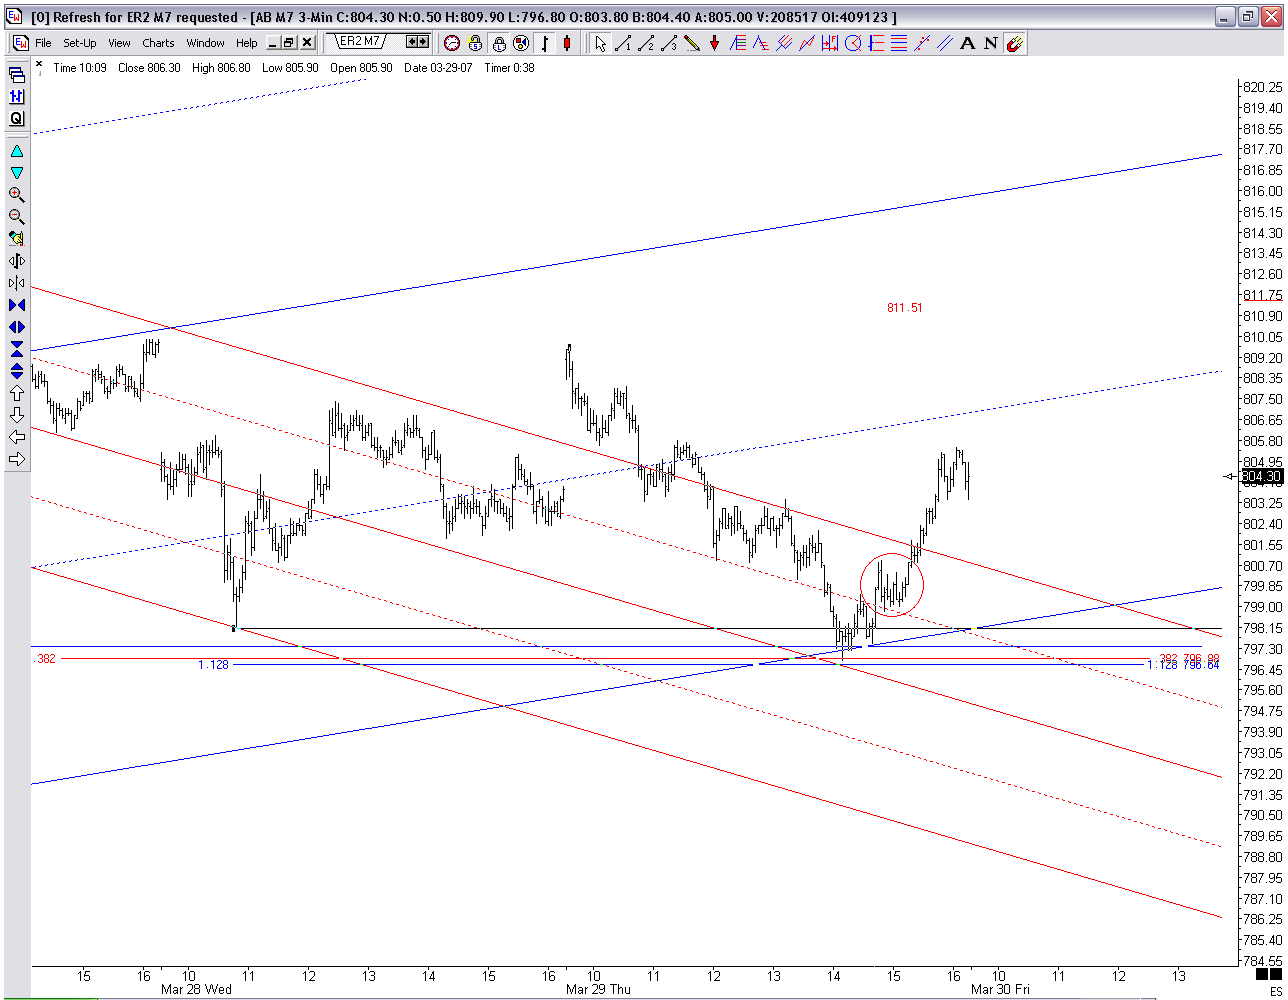
OK, rampers may be in now, right off this key area. Watch the 800, 801, and 802 layers for big clues. This low area is critical to the bigger picture.
MR
mreiserer
Rep: 110
Posts: 2,220
Amazing how price reacted dead on the lower //
JI
jimkane
Rep: 3,058
Posts: 33,089
Sometimes I just can't get over this methodology. M or Duane, post the 13/60 min obvious upsloping set ('locked' at the high from the 22nd), and add on horizontal lines for yesterday's low, and from the top of 'wave 1' on the 12th, plus the .382 off the low on the 5th. Show this on the 3-min, once the lines are on the chart. To spruce it up, show the downsloping set based on the move from the 26th, locked at yesterday's low. Notice where the ML hits. Although it is much more clear on the 1-min, highlight the 4-Point CP once it started up. Sometimes it is so clear it seems like it just can't possibly produce a reaction, yet it moved over seven points so far when I posted this.
MR
mreiserer
Rep: 110
Posts: 2,220
4pt in the circle. Duane you're the 4pt specialist.


Click image for original size
No Description Entered
RO
roofer
Rep: 3,689
Posts: 3,574
thankyou duane i knew it was back there somewhere...