Hi Jim,
Thanks for opening this Forum to your students and giving us an opportunity to show our charts and share our ideas.
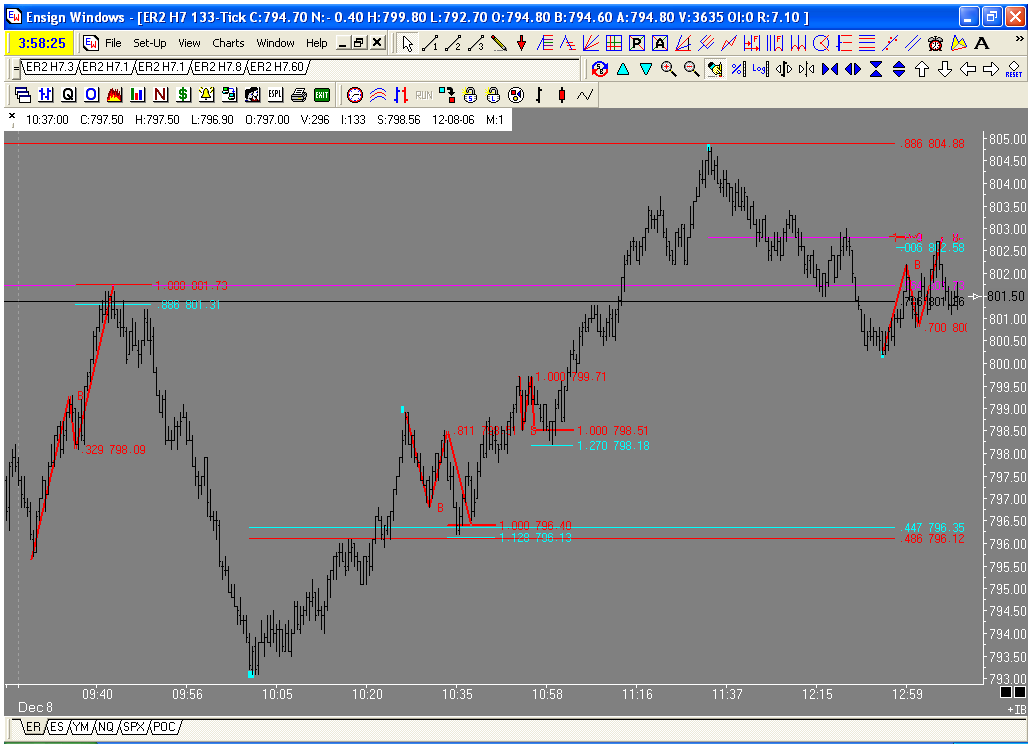
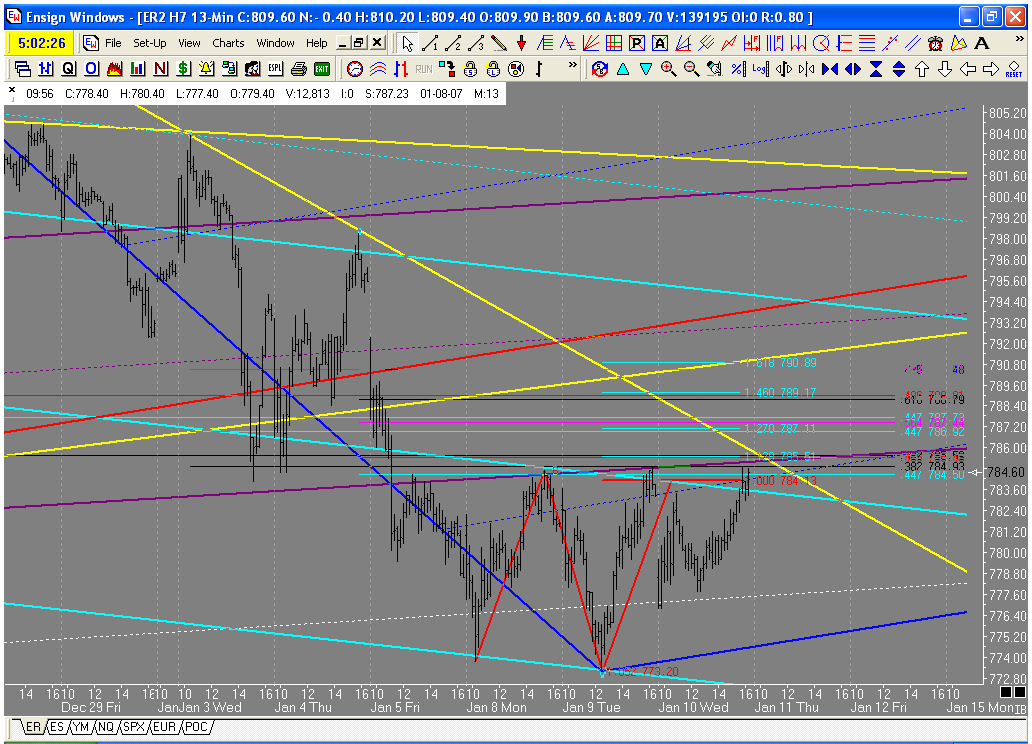
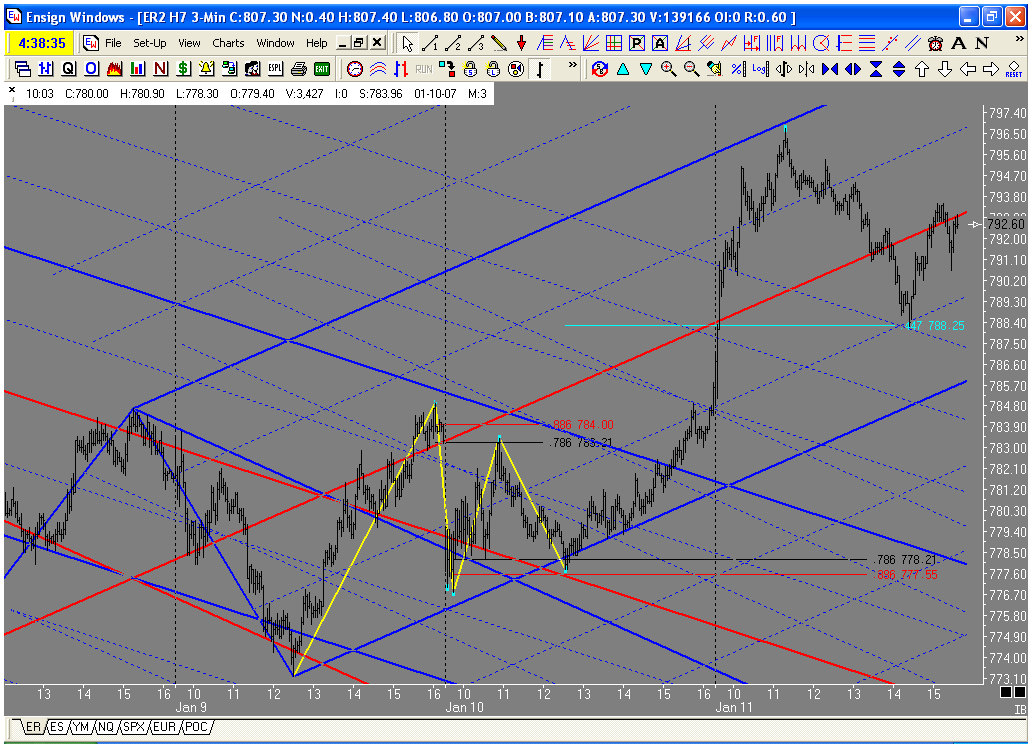
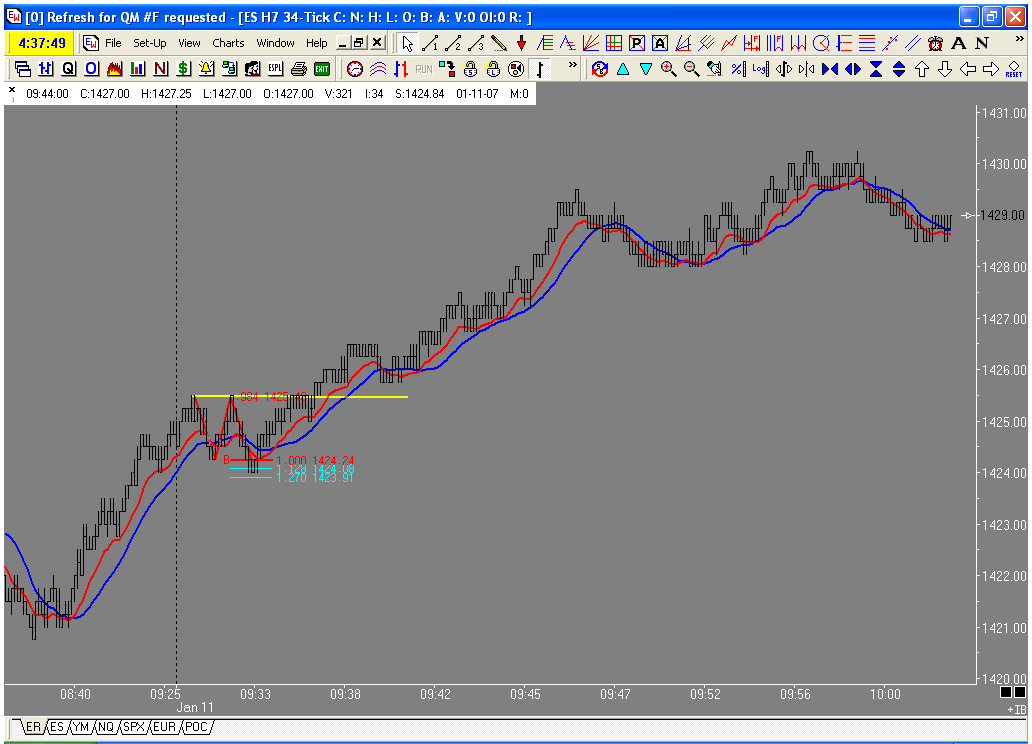
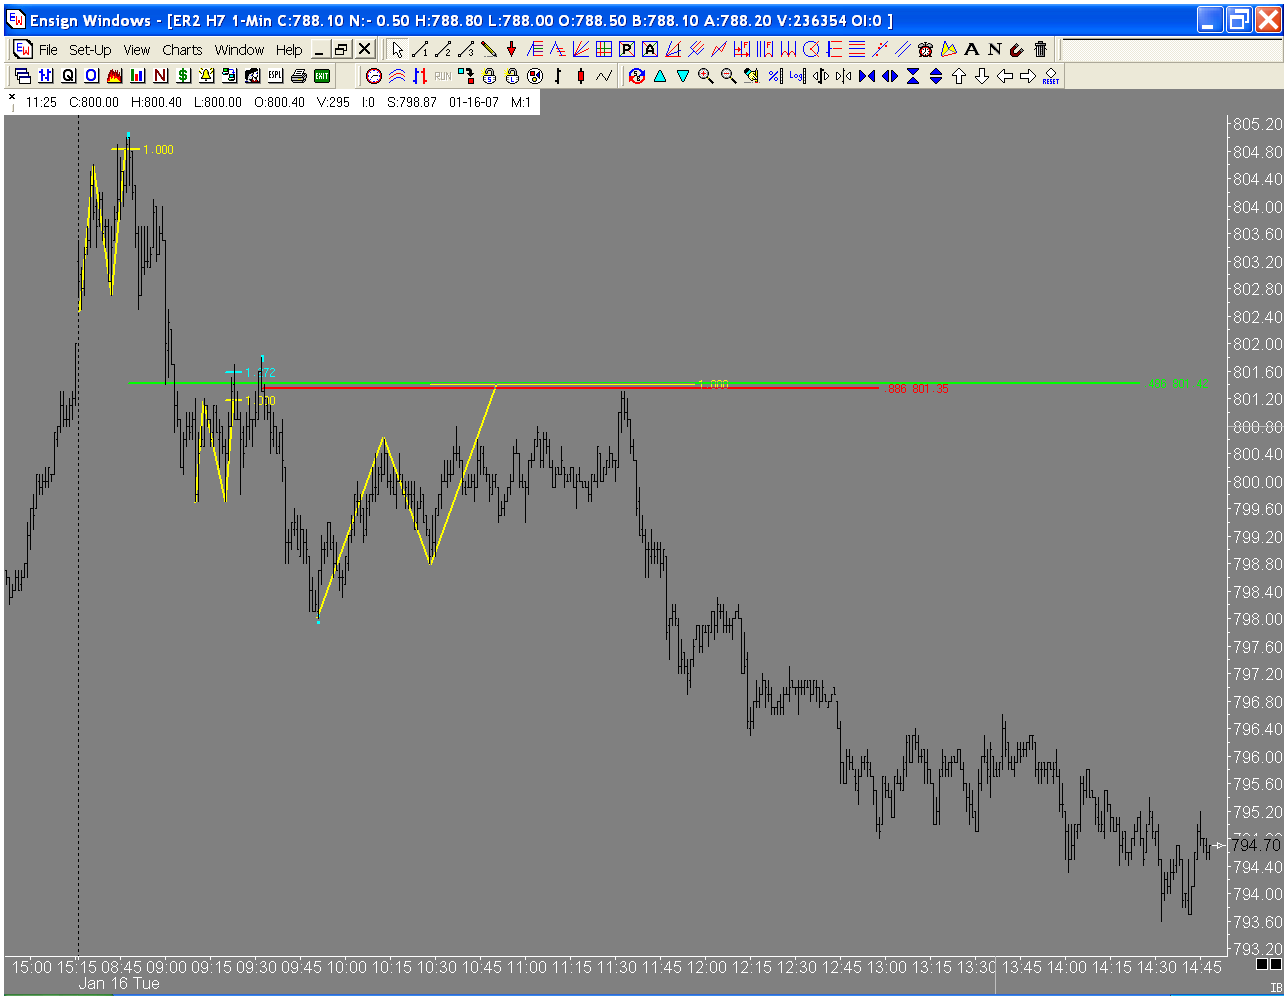
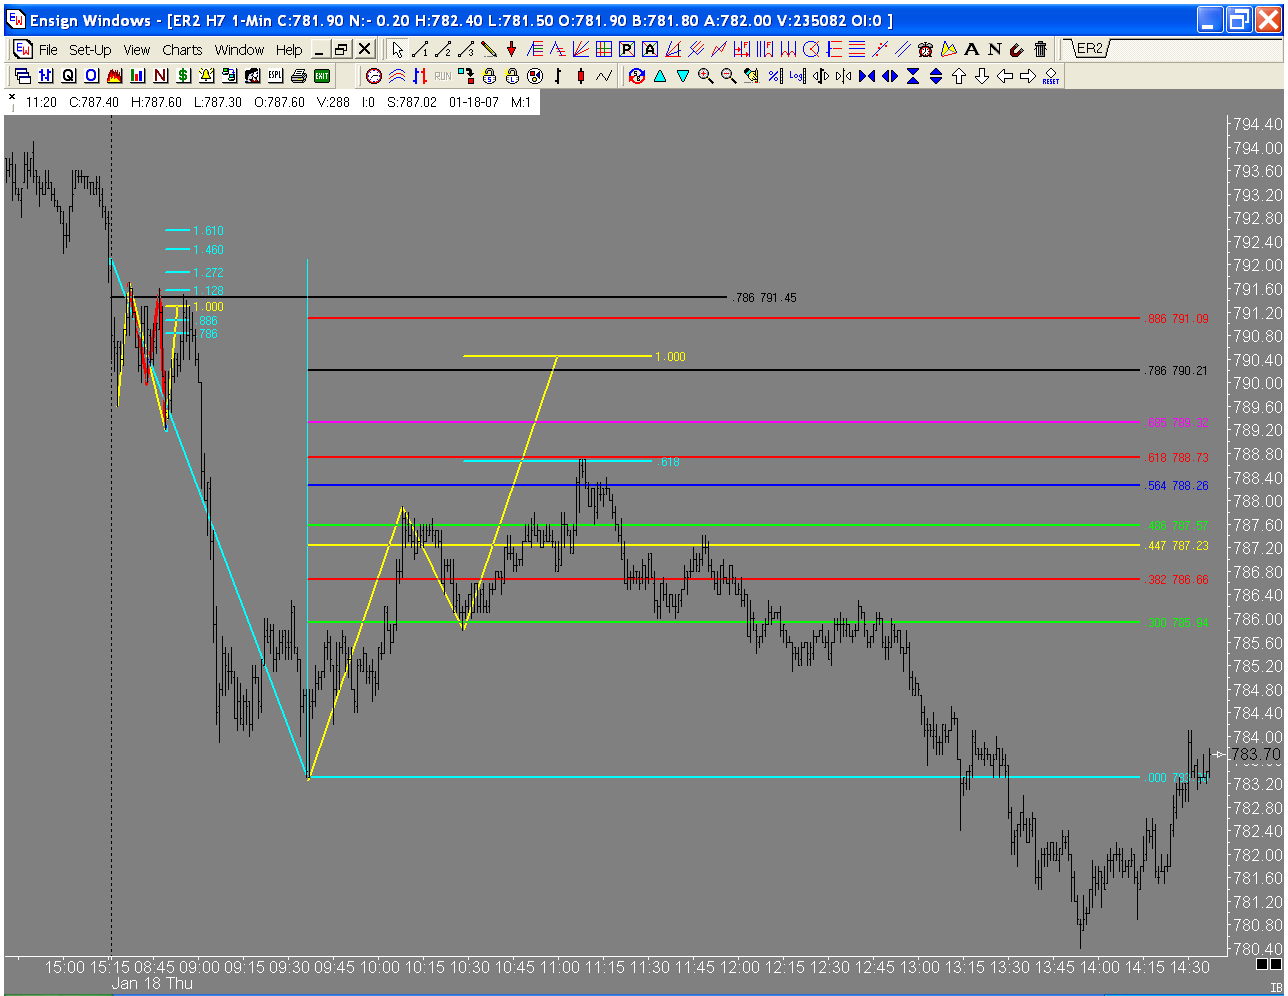
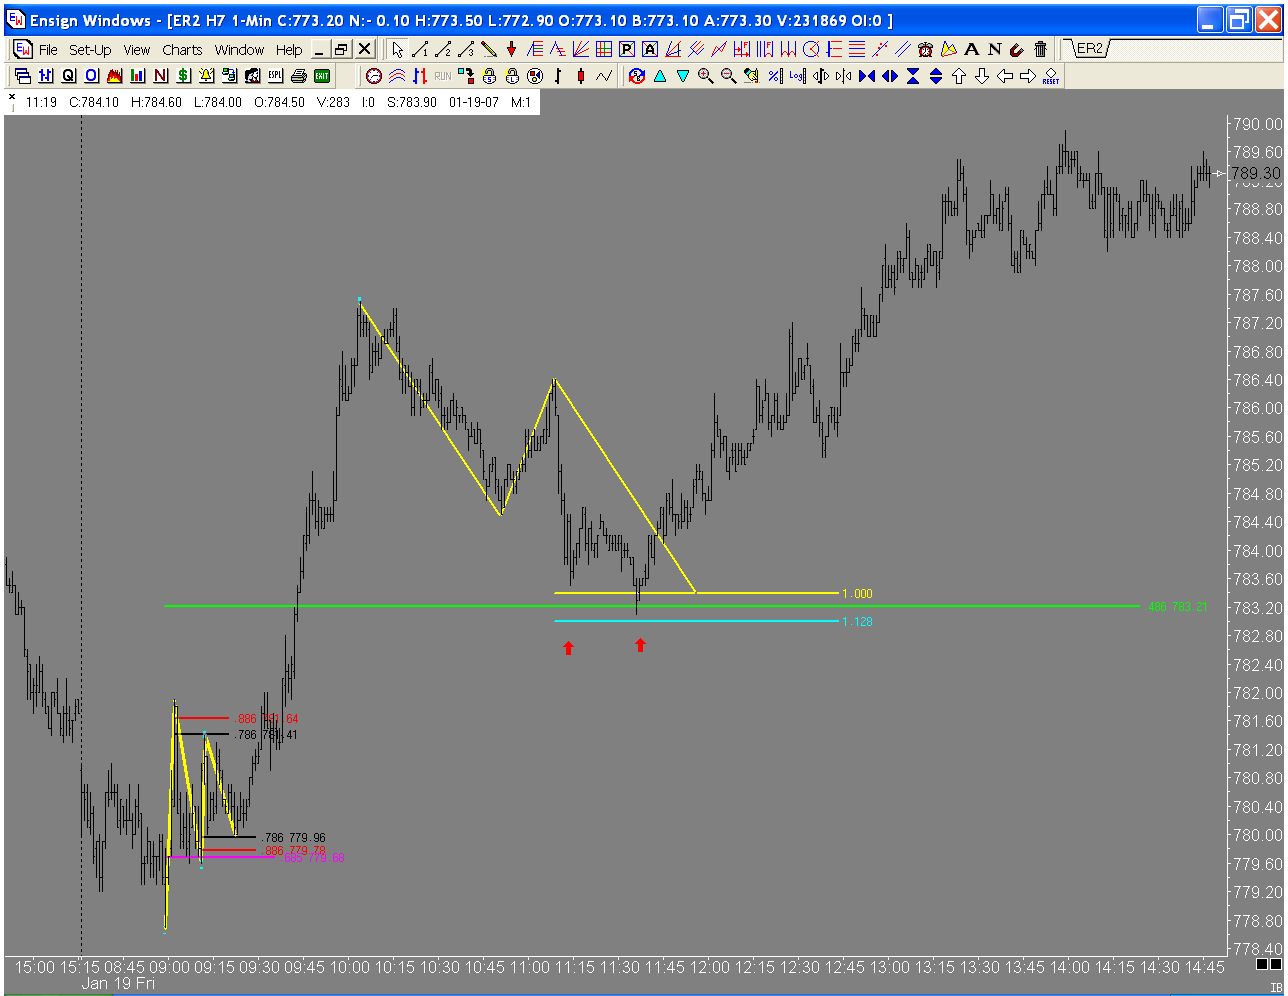
Here is a chart of todays ABCD's in the russell. I will post a context chart later. Today was one of those days where the market changes direction on Jim's unique Fib numbers, Had you been trading with standard fib numbers you may not have noticed these PTA's. Is it me or is .564 becomming more and more prevalent?
DU
Duane
Rep: 100
Posts: 1,095
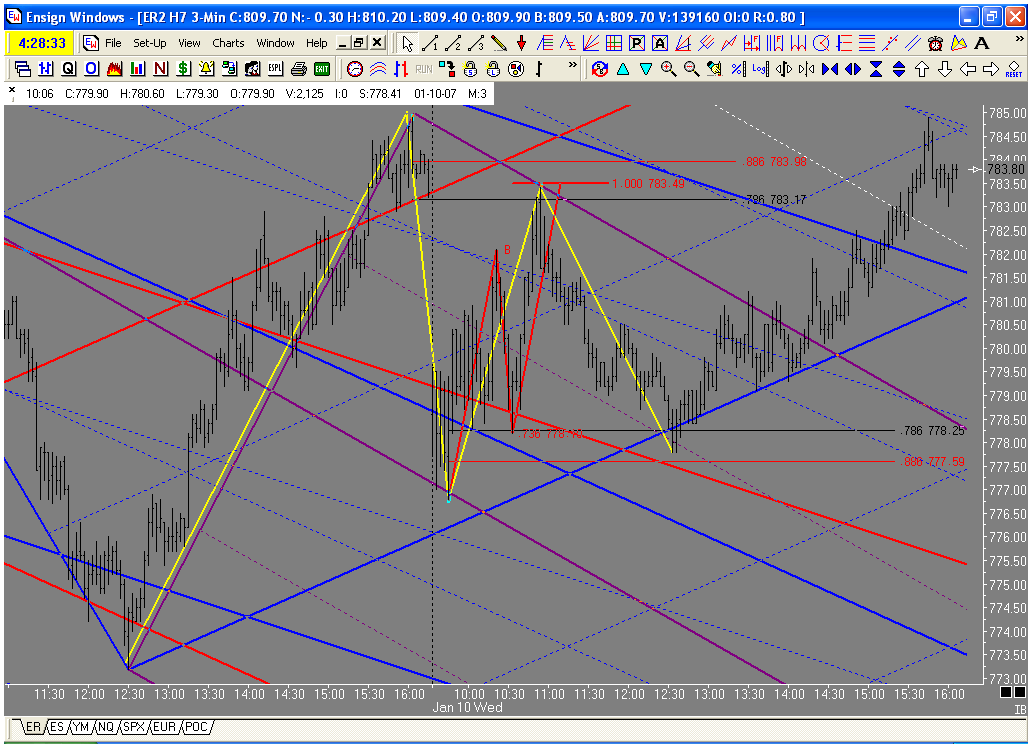
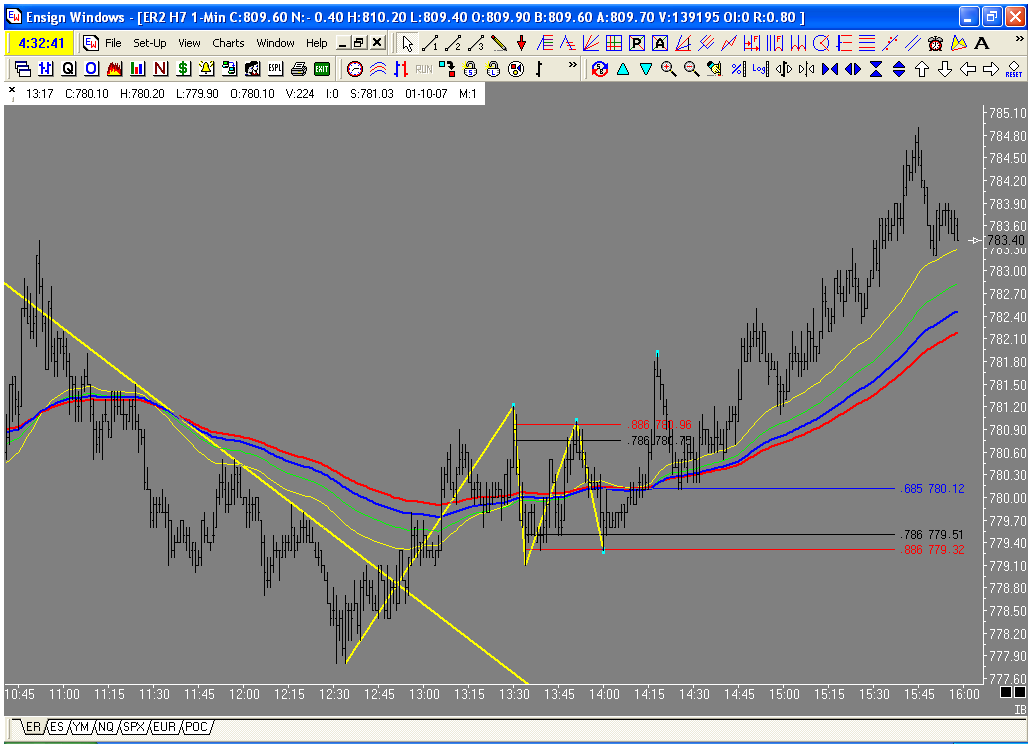
The charts say it all. Just incredible action today. ABCD into fib support and upper \\. Continuation pattern into lower \\. Kane trading methodology at its best.
The Kane Continuation pattern allows you to establish your position at the early part of the move before the move has broken out of the triangle, with a relatively small technically placed stop.
While most traders are wondering which way the move will break
The Kane Continuation pattern allows you to establish your position at the early part of the move before the move has broken out of the triangle, with a relatively small technically placed stop.
While most traders are wondering which way the move will break
JI
jimkane
Rep: 3,058
Posts: 33,089
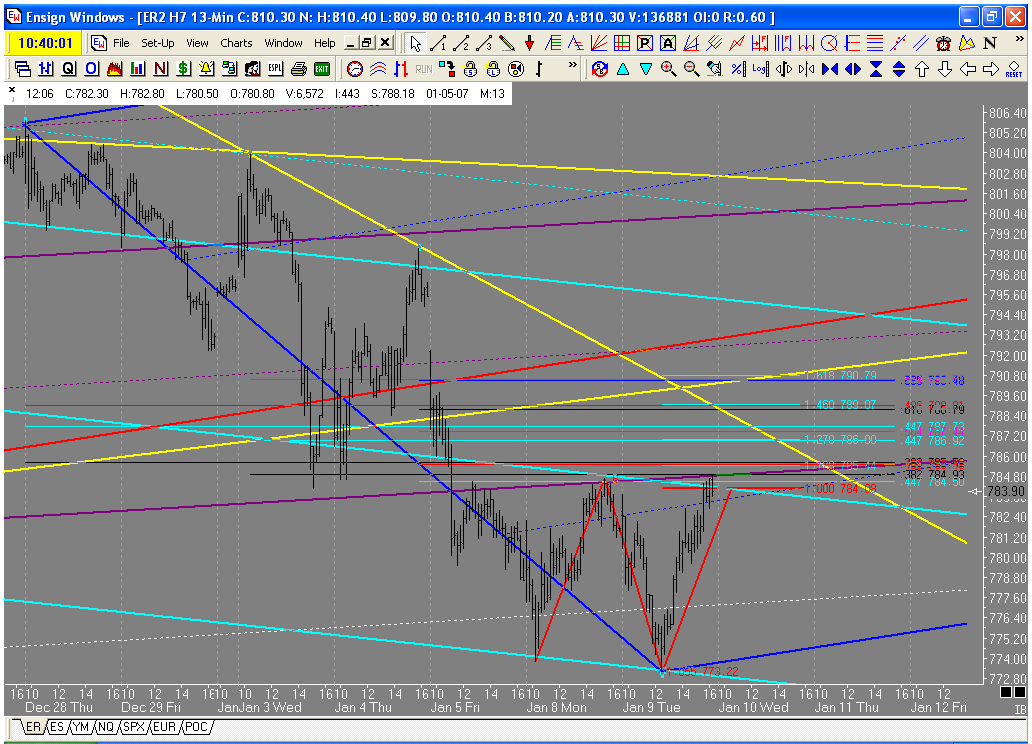
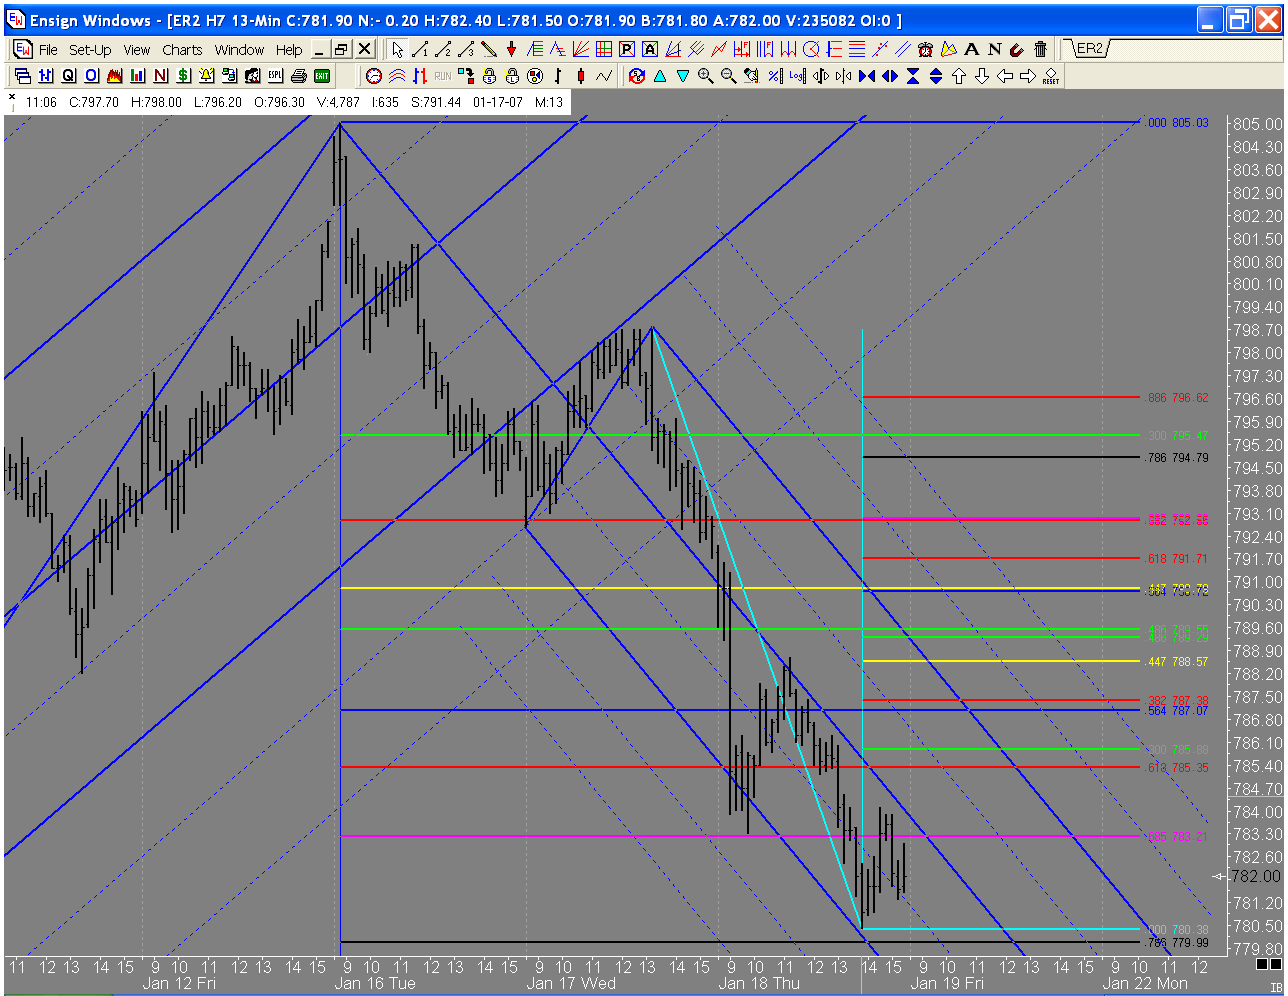
What is the possible 'context' here? The 'flat' ABCD produces a reaction dead off the upper //, rolls to a nice first thrust area, and then rockets up. No problem, but then drop and give me that new low for the move. It drops, and then ramps up and takes out the ABCD. So, the higher timeframe ABCD is guiding the action for now. If so, this looks like 'wave 3 of 3' in here. I'll watch the ABCD that forms from using the 'flat' ABCD's CD leg as my new AB leg. Why? Because the 'flat' may not be a failed 'flat', but the CD leg may have been a last thrust down (albeit one that only set a nominal new low), a 'wave 5' so to speak, and we may now be in the CD leg of an ABCD here. Where would that complete? Right at that same 60-minute line that was tested so many times before it finally broke. That is a key, key line. Now we see what the real intentions are. The main .382 comes in close to here, too, as well as a downsloping upper //.
DU
Duane
Rep: 100
Posts: 1,095
" but they frequently appear as 'wave 2's', and I keep an eye out for that "
JI
jimkane
Rep: 3,058
Posts: 33,089
Yes, exactly like you have highlighted on your 3-minute chart. I'm just full of little methodology tidbits, aren't I? When someone mentors with me they get a lot of these because I'm constantly talking and showing things, and they just come out as we work.
DU
Duane
Rep: 100
Posts: 1,095
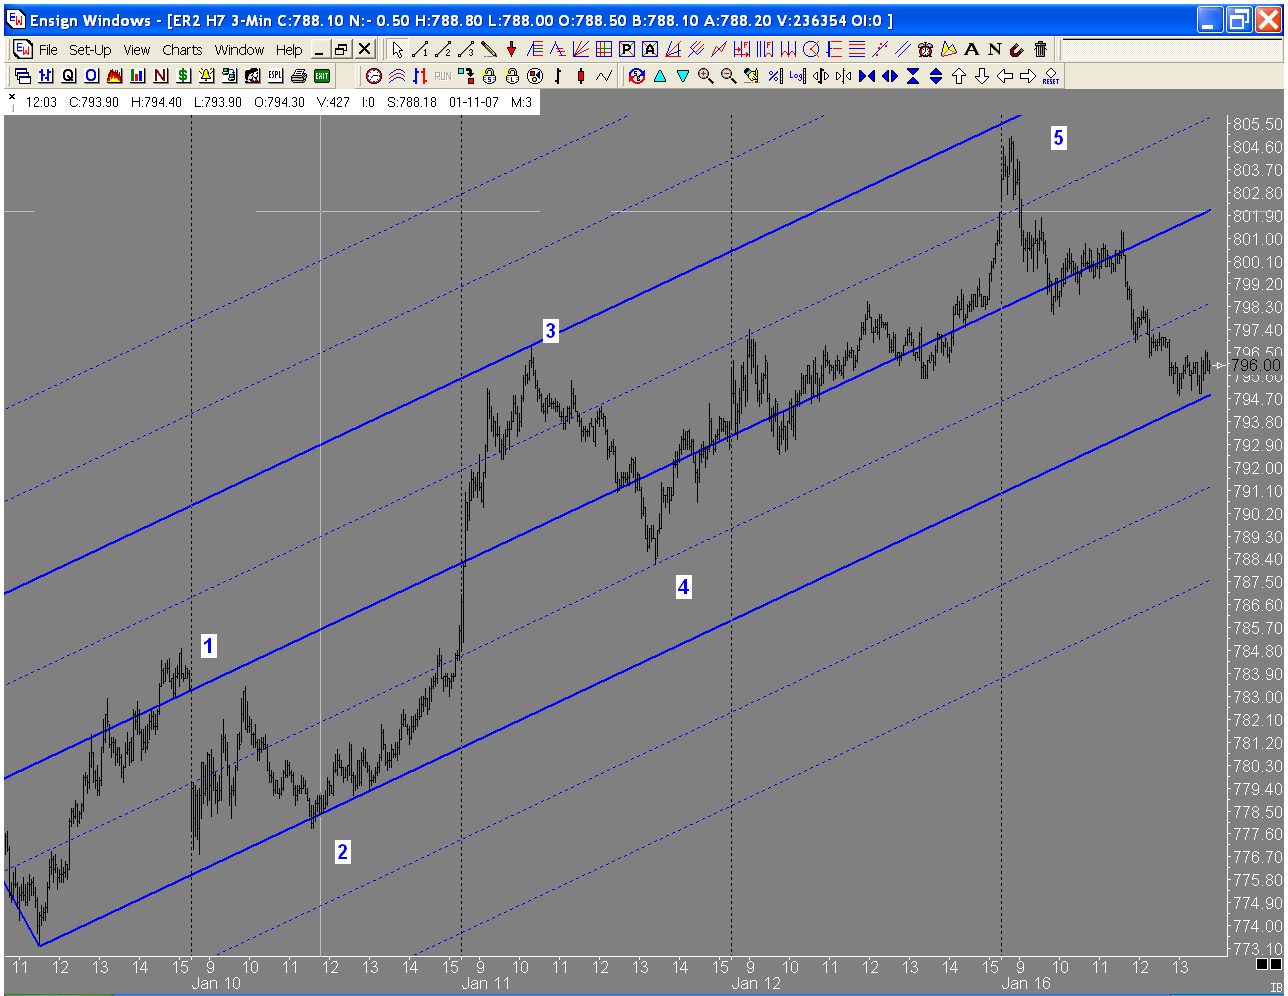
To quote Jim " its all about the ABCD's" That is my main setup, it is the "Holy Grail" of setups. It is on every chart on every timeframe. It suits my style of trading. Coming from a chart with 10 plus indicators, to a chart with no indicators is like a breath of fresh air. A very relaxed method of trading. Go with the trend, wait for an ABCD or trend continuation pattern at fib support and \\'s, scale down to a smaller time frame for a low risk entry, and let the trend do the rest. Look at todays action an ABCD with an ABCD in the BC leg, then an ABCD into the median line.
Thanks Jim !!!!
Thanks Jim !!!!