Hi Jim,
Thanks for opening this Forum to your students and giving us an opportunity to show our charts and share our ideas.
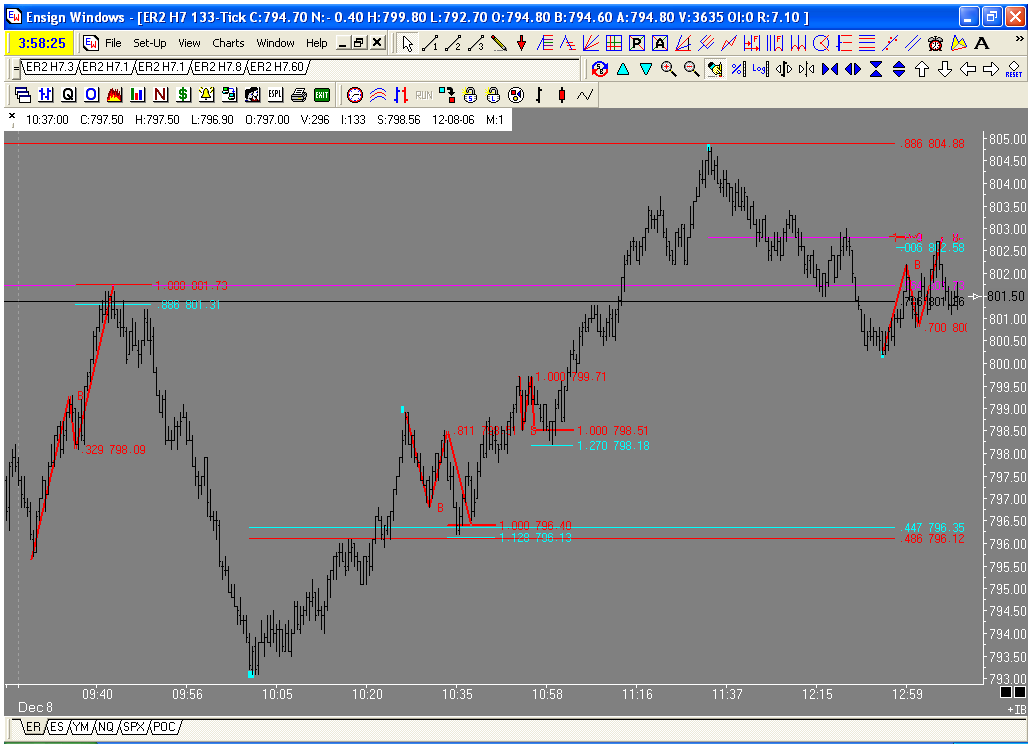
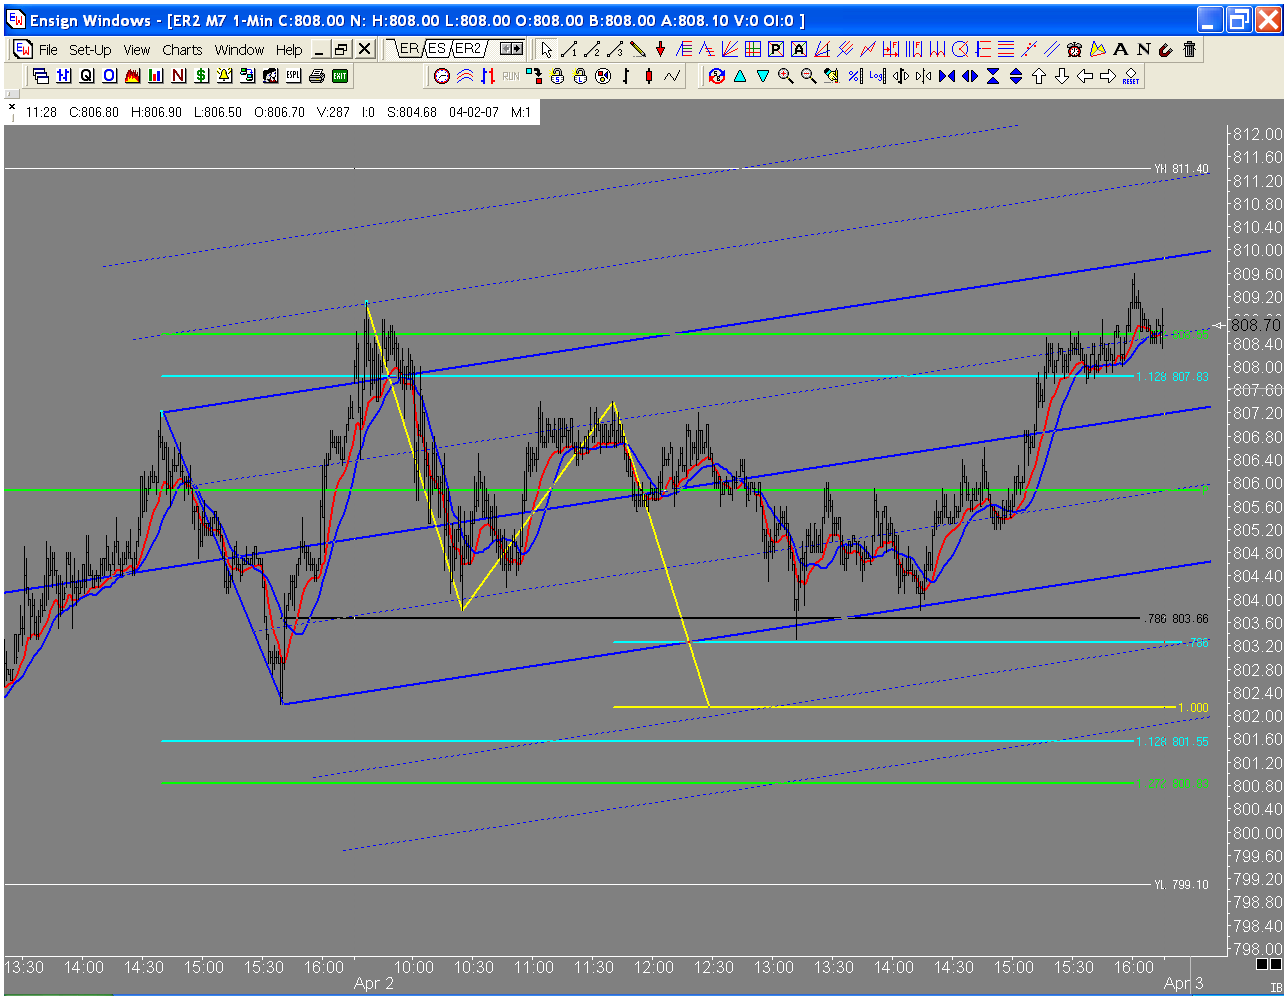
Here is a chart of todays ABCD's in the russell. I will post a context chart later. Today was one of those days where the market changes direction on Jim's unique Fib numbers, Had you been trading with standard fib numbers you may not have noticed these PTA's. Is it me or is .564 becomming more and more prevalent?
JI
jimkane
Rep: 3,058
Posts: 33,089
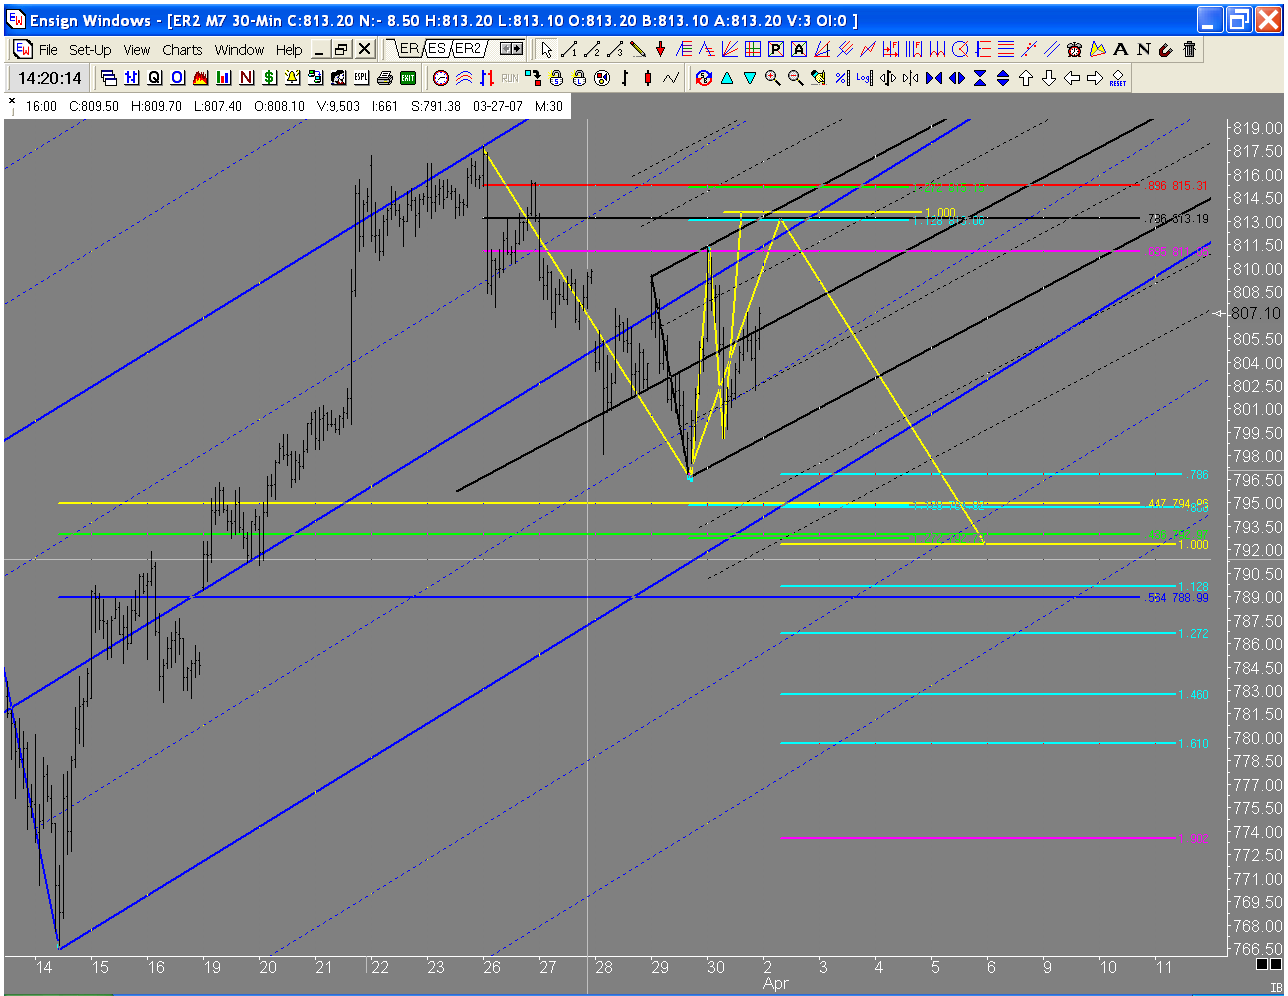
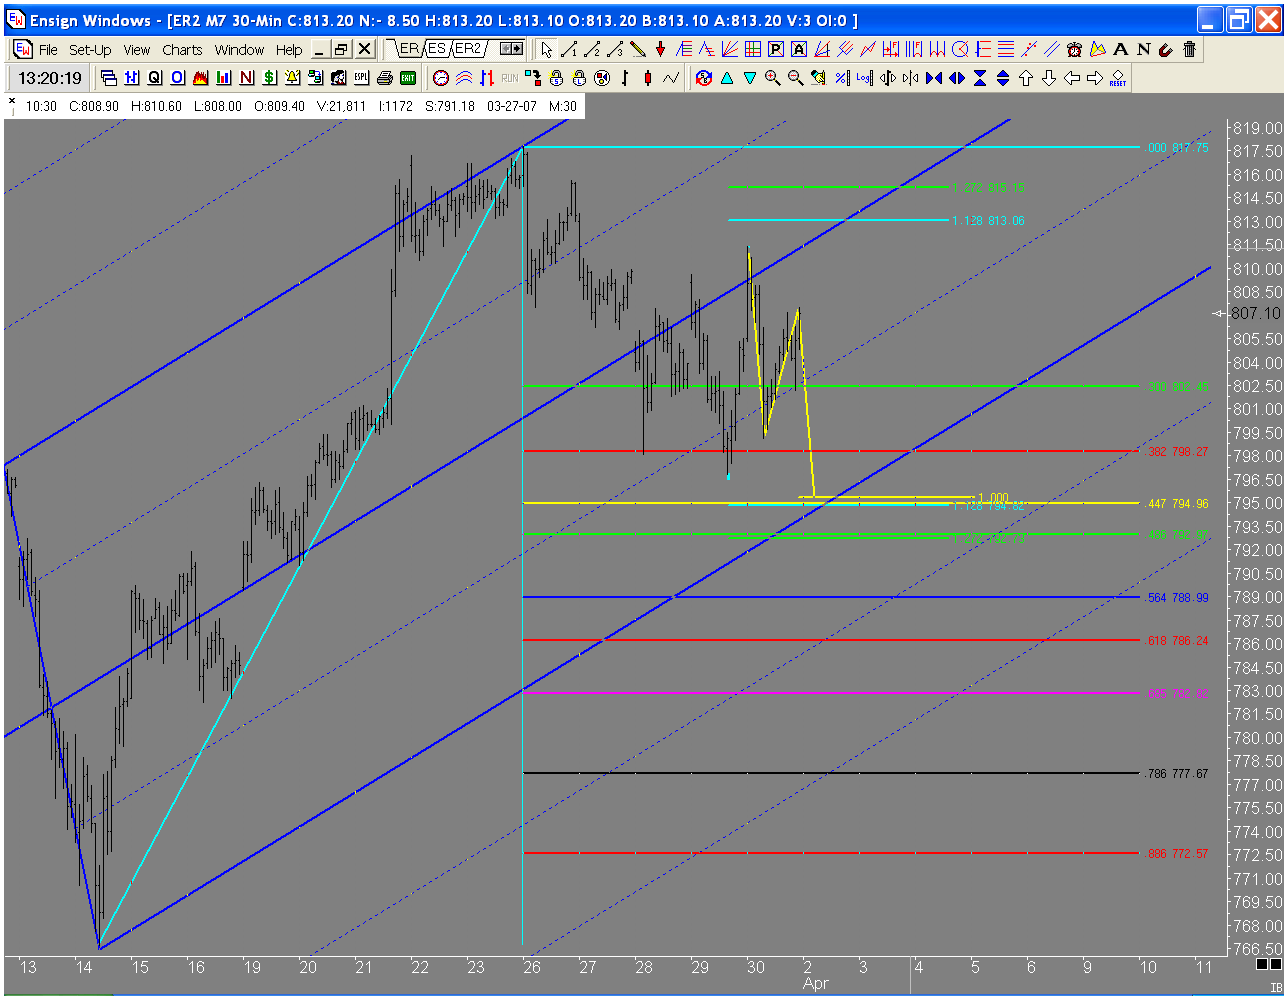
D, be very cautious with ABCD's in the direction of the trend like this. In this case the ABCD highlighted is in the direction of the correction trend so it isn't corrective for that, and it isn't set up to be corrective for the primary up trend on this chart, since it is only a part of the correction. This is one of the major steps in my work, as opposed to the 'pattern traders' and other ABCD users who don't use the ABCD like an Elliott abc only as a correction to a trend. I see people doing what you have done all the time, but it just doesn't fit into my work. That's not to say don't play with it, but understand why it doesn't fit as you play with it. Also, 'lock' your set on the recent high and see what that shows you.
MR
mreiserer
Rep: 110
Posts: 2,220
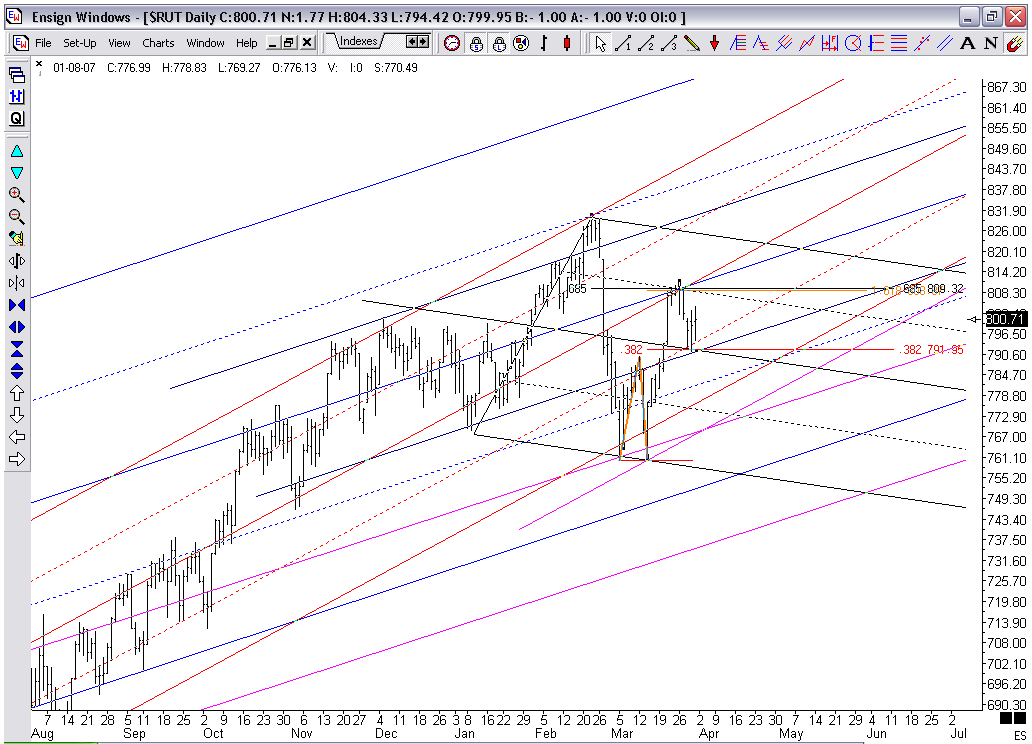
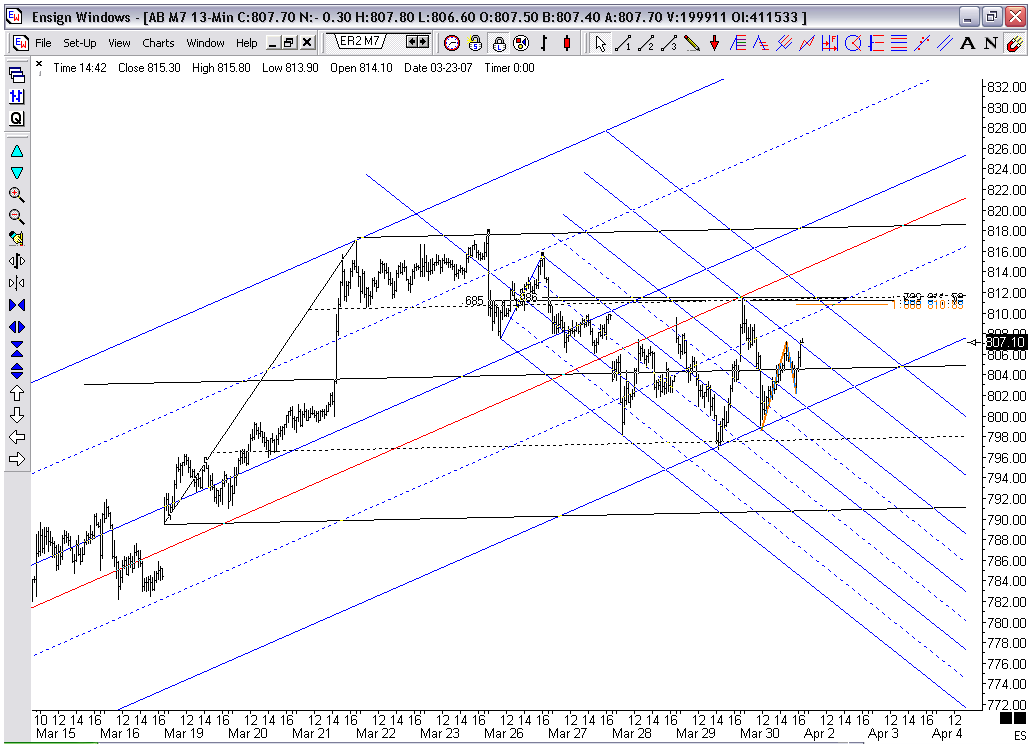
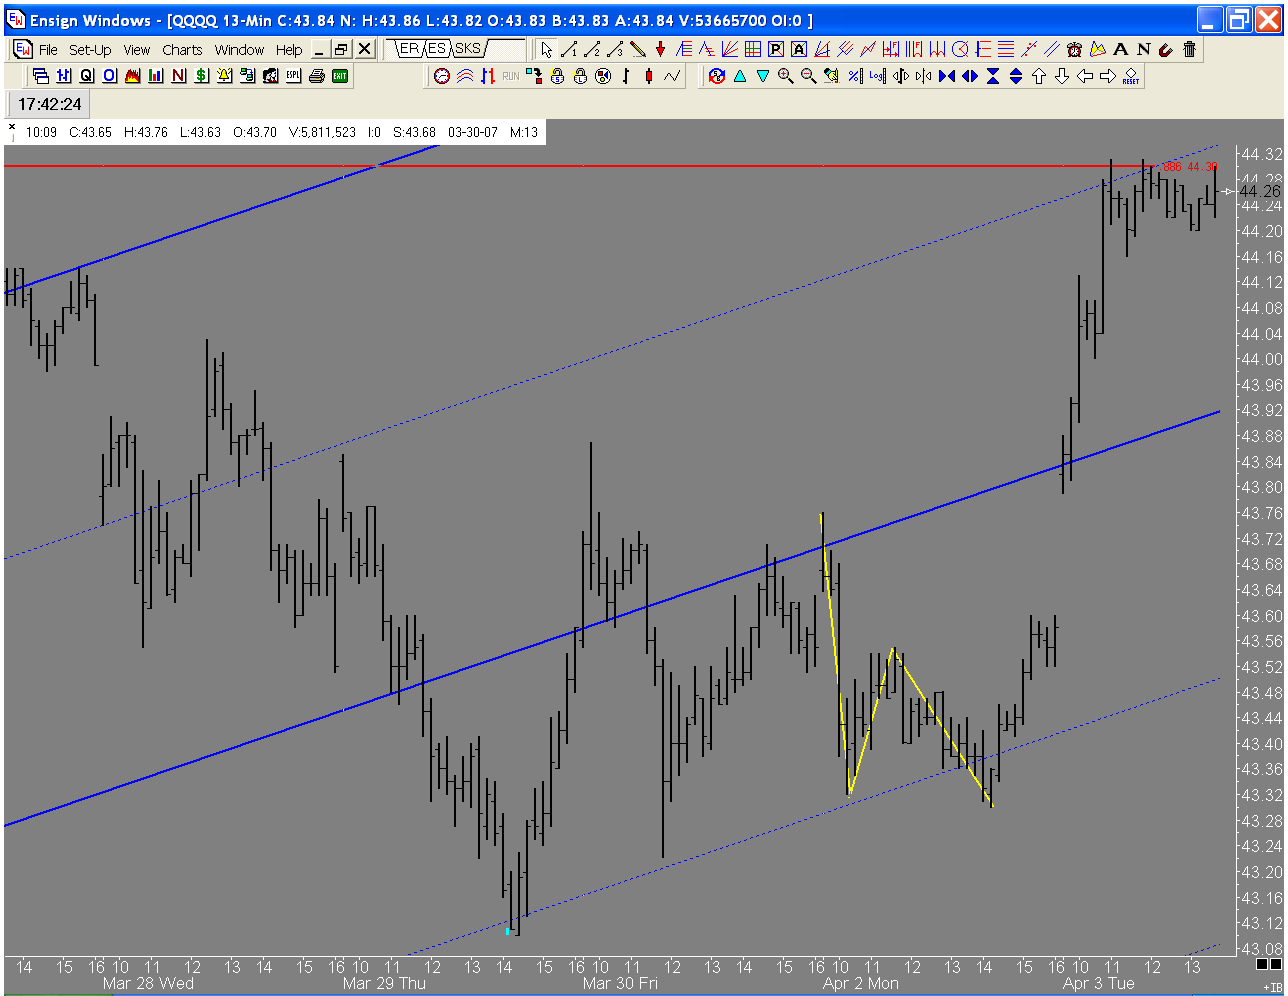
Charts starting with Cash Index.
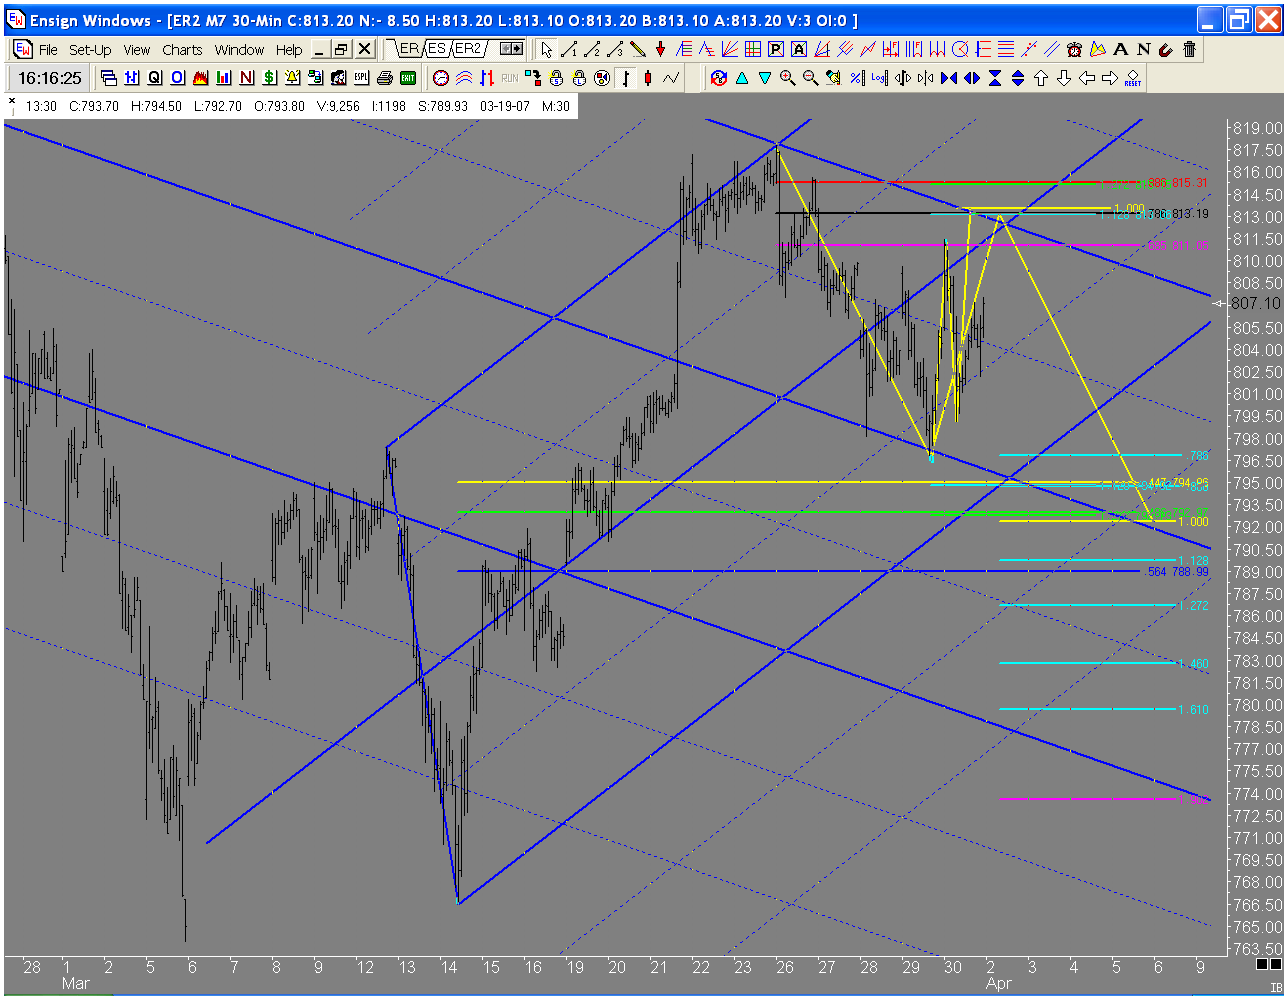
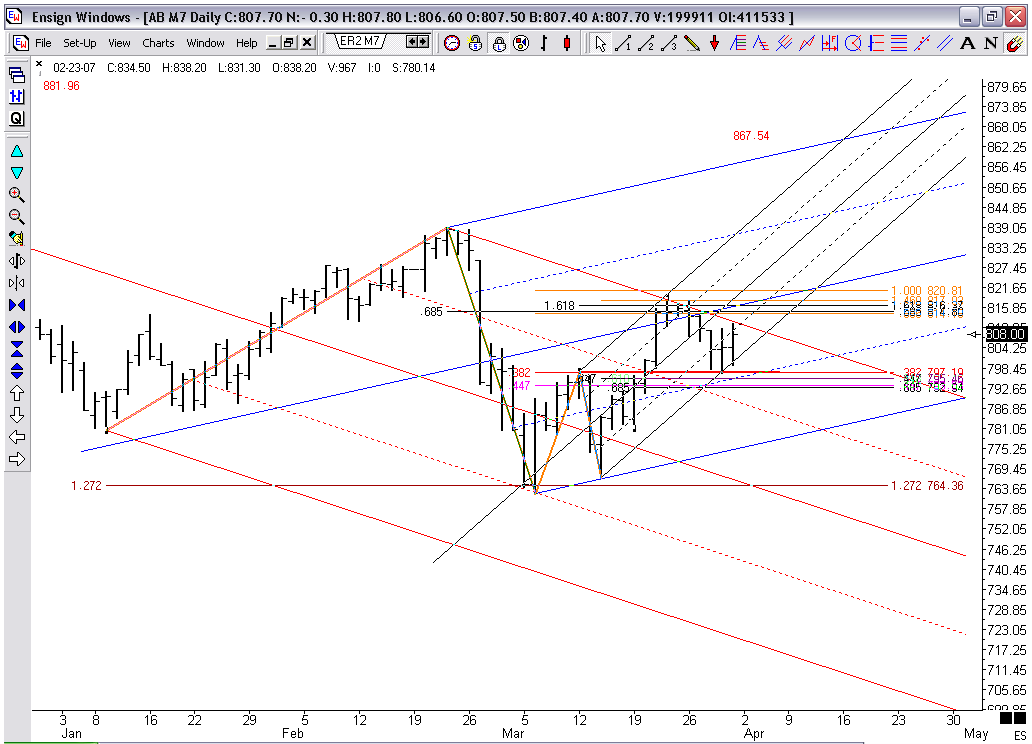
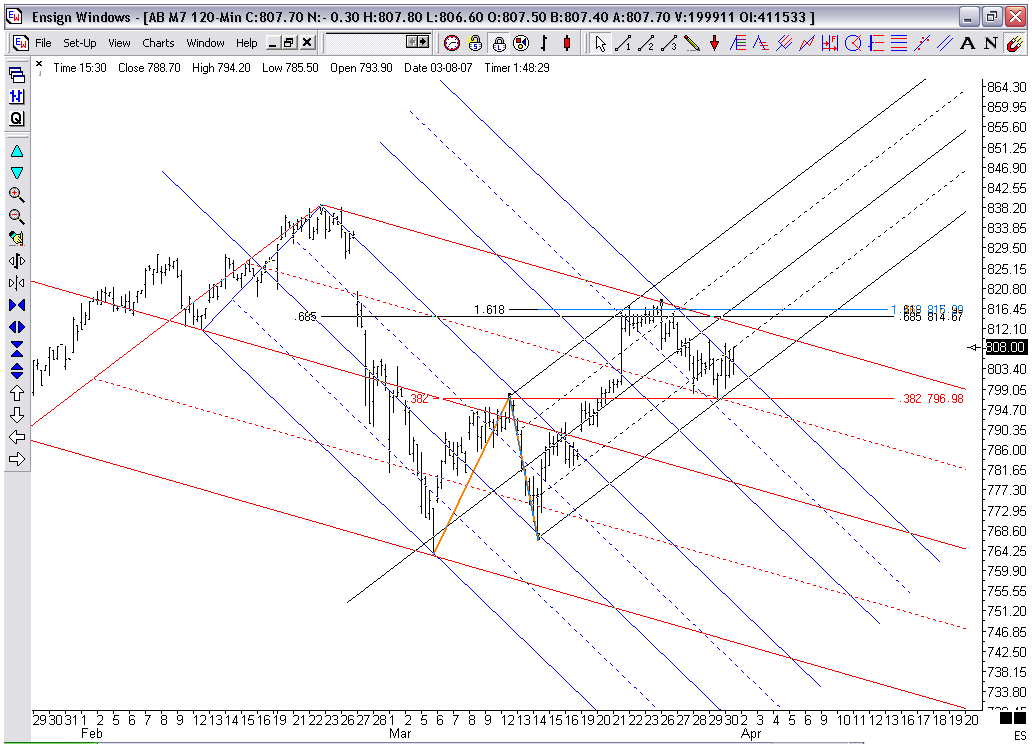
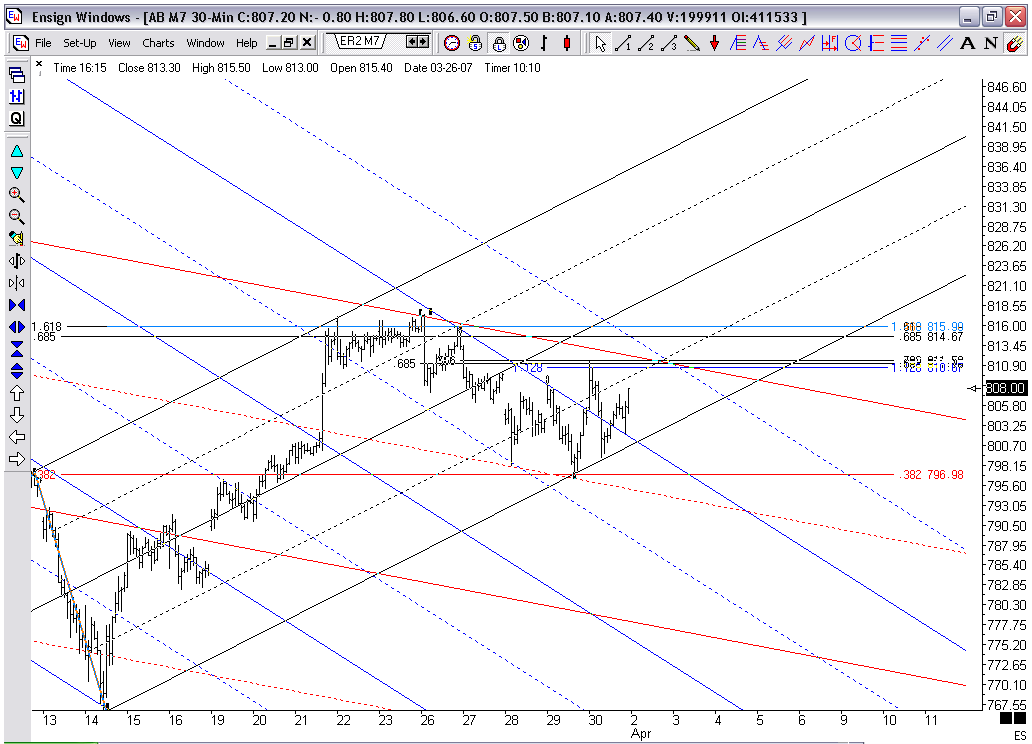
I think this could be an interesting spot around the 811. Are we at the beginning of a Wave 5 in the current uptrend or in the beginnings of Wave 3 of the longer term downtrend that started with the all-time high in Feb? So many scenarios, only price will tell.
The red line on the 13min is a .618 division line.
JI
jimkane
Rep: 3,058
Posts: 33,089
What a coil. This is wound so tight it looks ready to explode any second now...