MyPivots
Sign In
DU
Duane
Rep: 100
Posts: 1,095
Hi Jim,

Thanks for opening this Forum to your students and giving us an opportunity to show our charts and share our ideas.

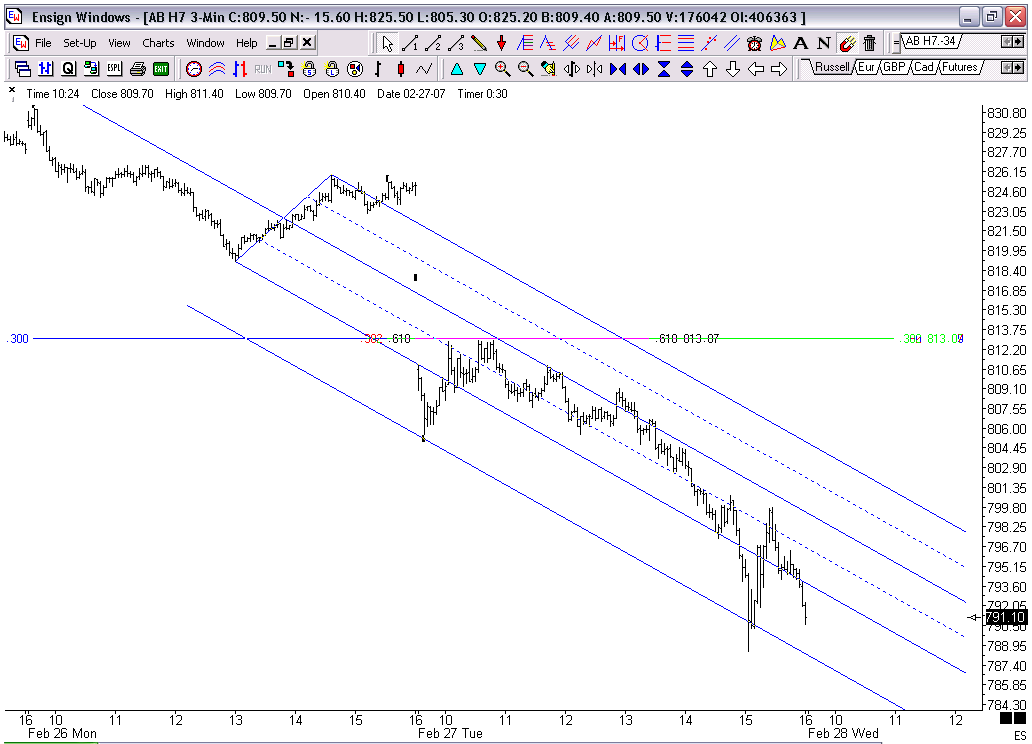
Here is a chart of todays ABCD's in the russell. I will post a context chart later. Today was one of those days where the market changes direction on Jim's unique Fib numbers, Had you been trading with standard fib numbers you may not have noticed these PTA's. Is it me or is .564 becomming more and more prevalent?

Click image for original size
No Description Entered
MR
mreiserer
Rep: 110
Posts: 2,220
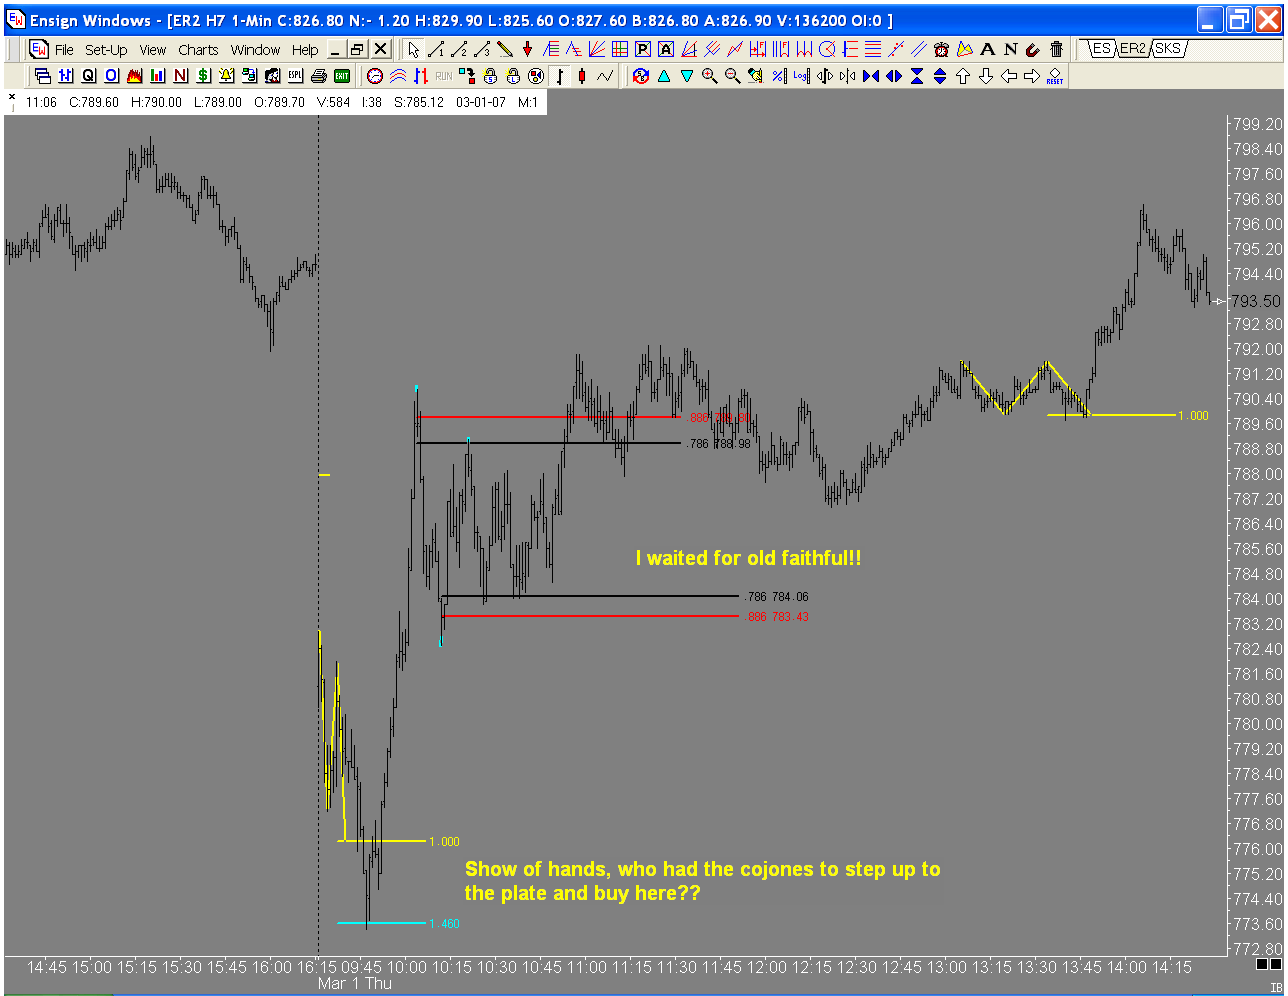
Here's what I saw today. I have rarely ever seen such a tight fib overlap. Same goes for the one Jim pointed out later on.


Click image for original size
No Description Entered
JI
jimkane
Rep: 3,058
Posts: 33,089
Yes, and it was the 'new' B=D ABCD there, too.
RO
roofer
Rep: 3,689
Posts: 3,574
duane---really appreciate your russell charts
MR
mreiserer
Rep: 110
Posts: 2,220
quote:
Originally posted by jimkane

Yes, and it was the 'new' B=D ABCD there, too.


Hmmm. Not familiar with that one, but from looking at it it kinda looks like a 'reverse' double top/bottom ABCD if that makes sense (instead of AC forming the double top/bottom, it's BD)

JI
jimkane
Rep: 3,058
Posts: 33,089
Yes, it is one of 4-6 'newer' variations I haven't published but show to mentor students.
DU
Duane
Rep: 100
Posts: 1,095


Click image for original size
No Description Entered

JI
jimkane
Rep: 3,058
Posts: 33,089
Duane,

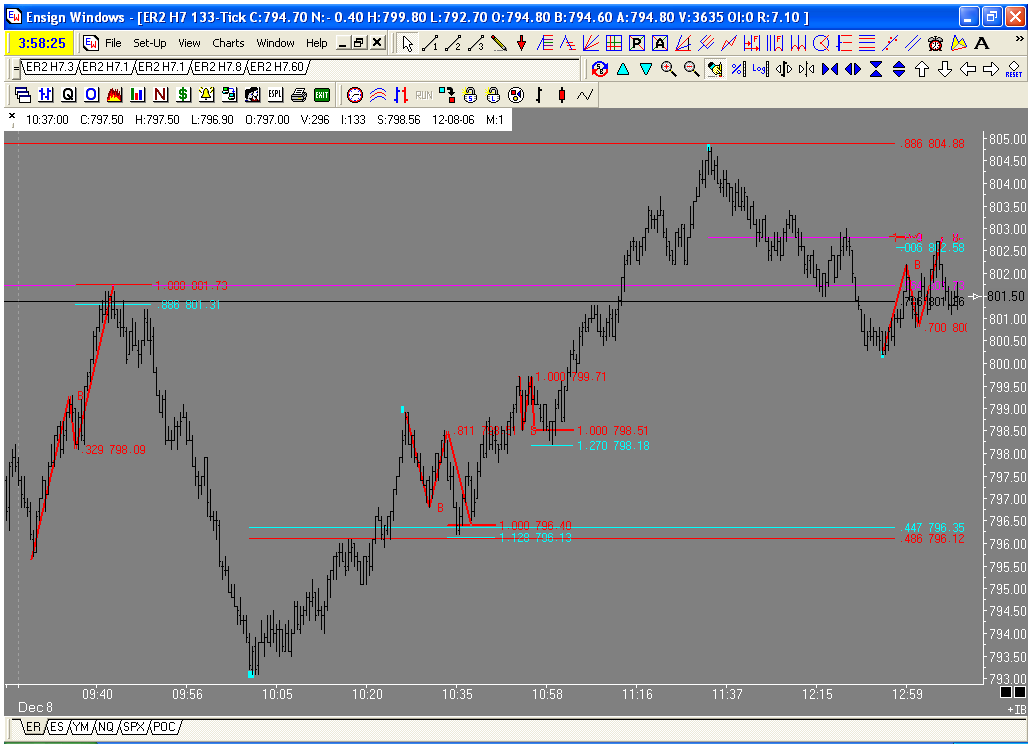
Can you add back that 60-minute set you recently showed, with that outer division line you had on it, but on this timeframe here, or on a 3-minute? Also add a horizontal line for the significant low on Jan 9 at about 11:30, and lastly a 1.618 external retracement of the bounce up from yesterday, low to high? Then answer the question about how crazy that low actually looked at that point.
JI
jimkane
Rep: 3,058
Posts: 33,089
Duane,

One more thing that would be very educational, I think. Do a 34-tick chart with all the data from the high at around 5 AM eastern up to the open, and note two things. Was this actually plunging, like the 1-minute chart makes it look? Had it done a lot of sideways stabilizing before the open? Very important inforamtion to be looking at, IMO.
JI
jimkane
Rep: 3,058
Posts: 33,089
And I think your point on the chart is exactly why this played out. You are my quote man, what did I say in one of the books about if anything preferring a scary plunge into an area because it scares most people away? Looking at the tick chart, this wasn't actually scary at all.
JI
jimkane
Rep: 3,058
Posts: 33,089
Want some real fun? Show yesterday's and today's action with the respective daily pivots. This is something, along with the opening price, that I have on my chart every day.
RO
roofer
Rep: 3,689
Posts: 3,574
thankyou duane i knew it was back there somewhere...