Hi Jim,
Thanks for opening this Forum to your students and giving us an opportunity to show our charts and share our ideas.
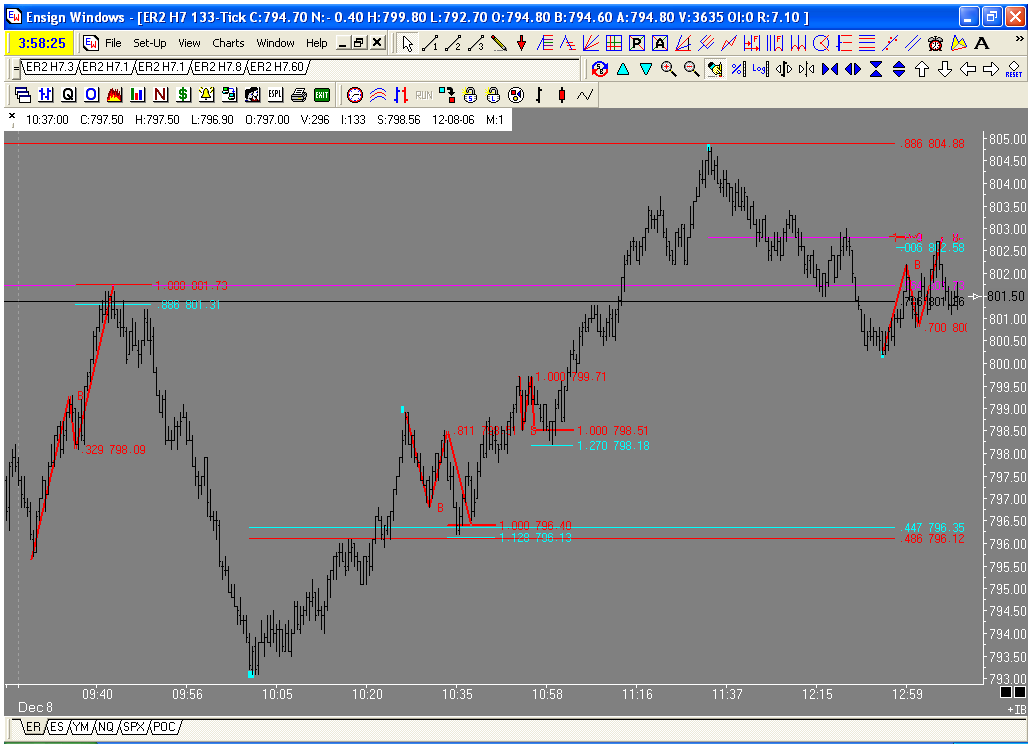
Here is a chart of todays ABCD's in the russell. I will post a context chart later. Today was one of those days where the market changes direction on Jim's unique Fib numbers, Had you been trading with standard fib numbers you may not have noticed these PTA's. Is it me or is .564 becomming more and more prevalent?
- Page(s):
- 1
- 2
- 3
- 4
- 5
- 6
- 7
- 8
- 9
- 10
- 11
- 12
- 13
- 14
- 15
- 16
- 17
- 18
- 19
- 20
- 21
- 22
- 23
- 24
- 25
- 26
- 27
- 28
- 29
- 30
- 31
- 32
- 33
- 34
- 35
- 36
- 37
- 38
- 39
- 40
- 41
- 42
- 43
- 44
- 45
- 46
- 47
- 48
- 49
- 50
- 51
- 52
- 53
JI
jimkane
Rep: 3,058
Posts: 33,089
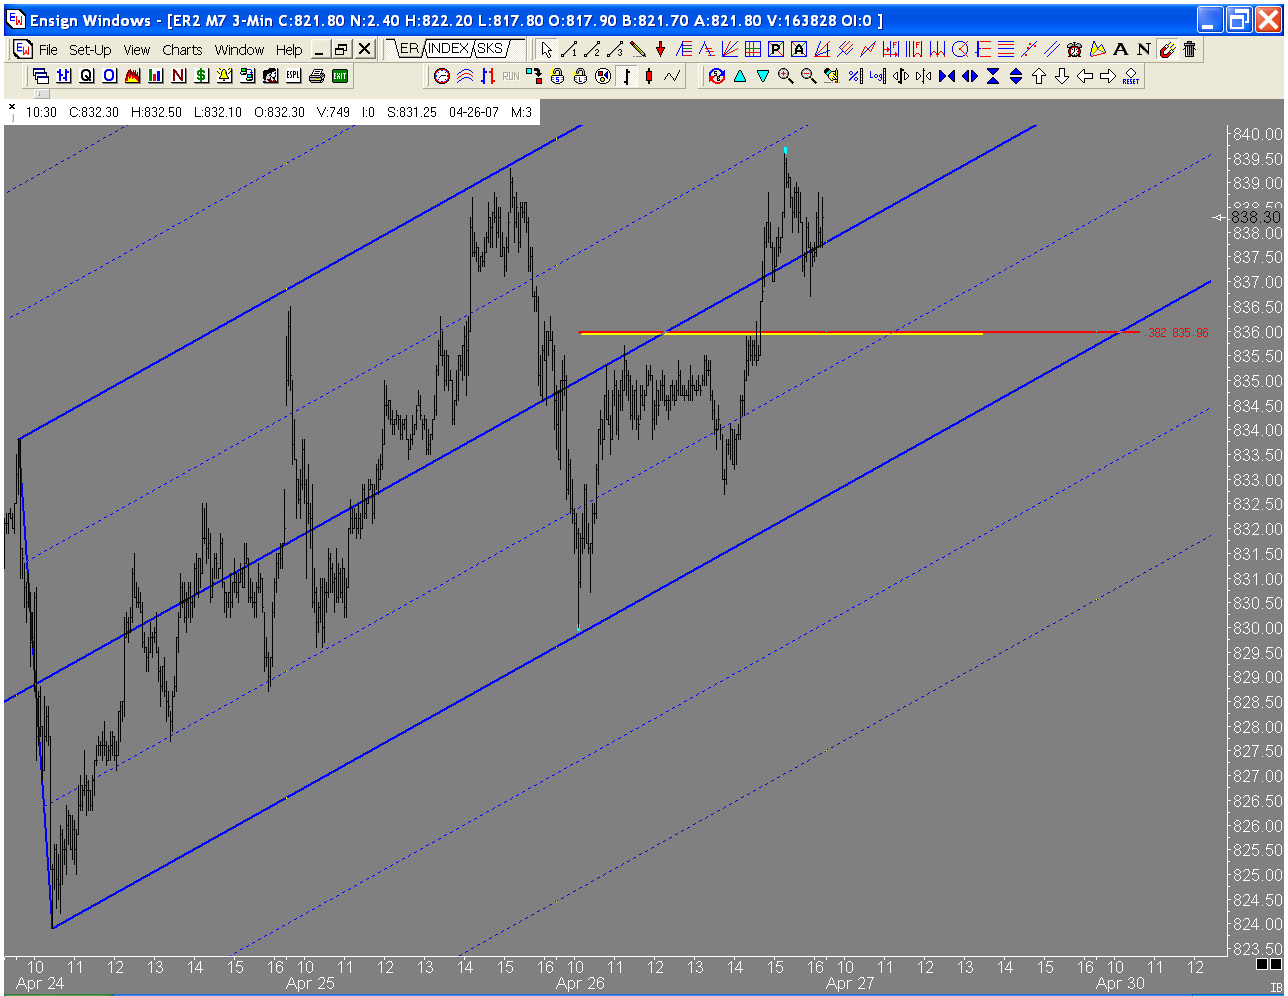
Here's one for you, D. Do the pivot for tomorrow (HLC/3, RTH), and the .382 from today's low to high. Although I have to choose the appropriate swing points, this is something I see a lot, especially on days where there is a nice trend (not gap and run days, of course). Pretty cool, and just another coincidence, I'm sure.
DU
Duane
Rep: 100
Posts: 1,095
My records show that the last 2 fridays have been unusually strong. Lets hope they keep it going!
JI
jimkane
Rep: 3,058
Posts: 33,089
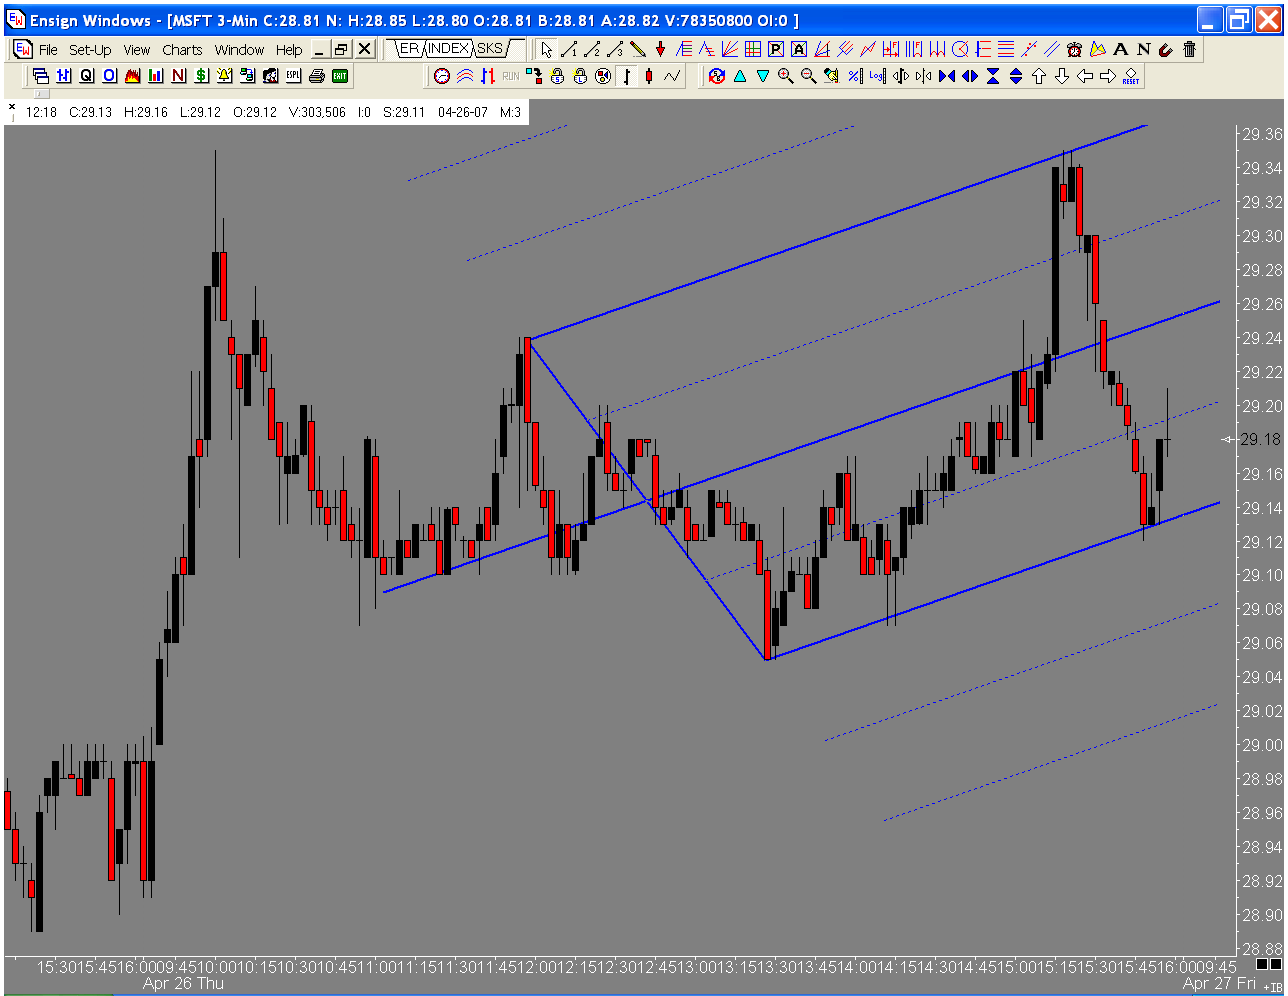
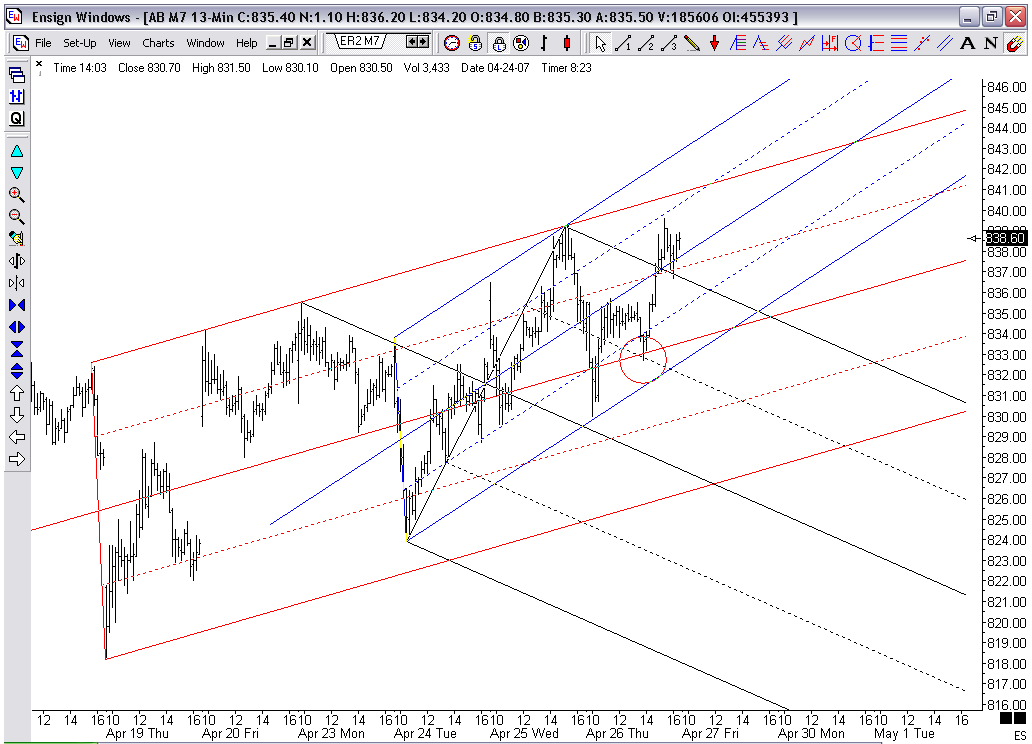
Here's the thing. Notice this. Three drives down to yesterday's mid-day swing-low. Right up to the daily pivot. Rolled hard, right to yesterday's low. Up to that mid-day swing-low again, where it rolled, for now. I have to be looking at these things in conjunction with the methodology (well, they are a part of the methodology).