MyPivots
Sign In
DU
Duane
Rep: 100
Posts: 1,095
Hi Jim,

Thanks for opening this Forum to your students and giving us an opportunity to show our charts and share our ideas.

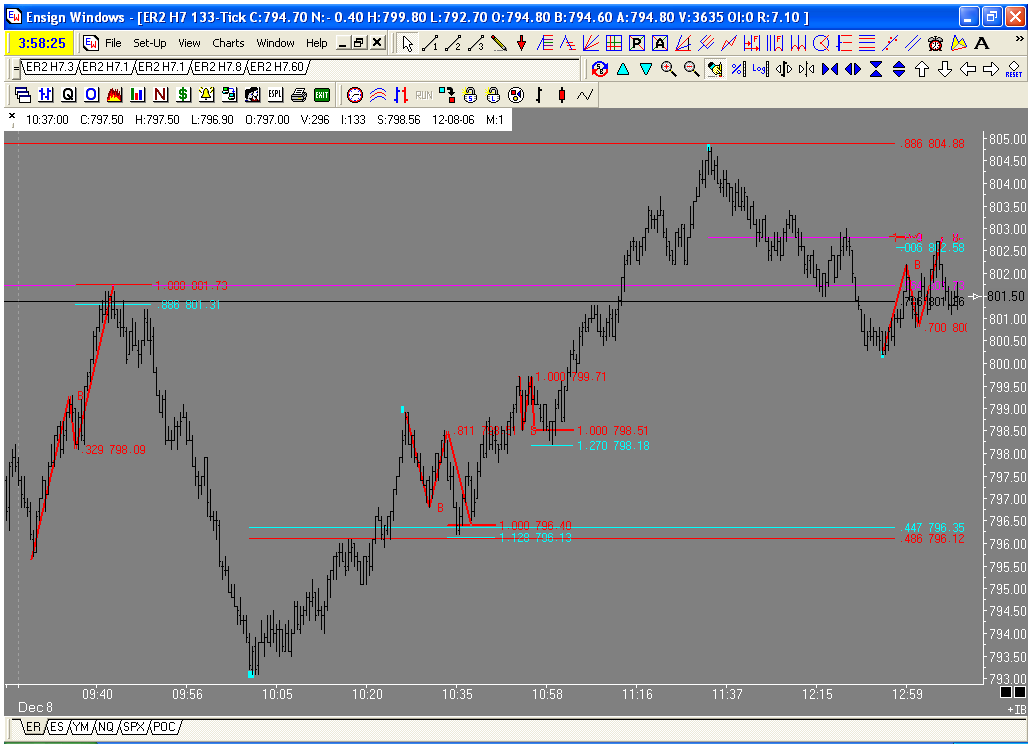
Here is a chart of todays ABCD's in the russell. I will post a context chart later. Today was one of those days where the market changes direction on Jim's unique Fib numbers, Had you been trading with standard fib numbers you may not have noticed these PTA's. Is it me or is .564 becomming more and more prevalent?

Click image for original size
No Description Entered
MR
mreiserer
Rep: 110
Posts: 2,220
That's an interesting area price is getting into now. It just hit the .786 of a 'potential' ABCD that has the ABCD that formed on Friday in the BC leg.
DU
Duane
Rep: 100
Posts: 1,095
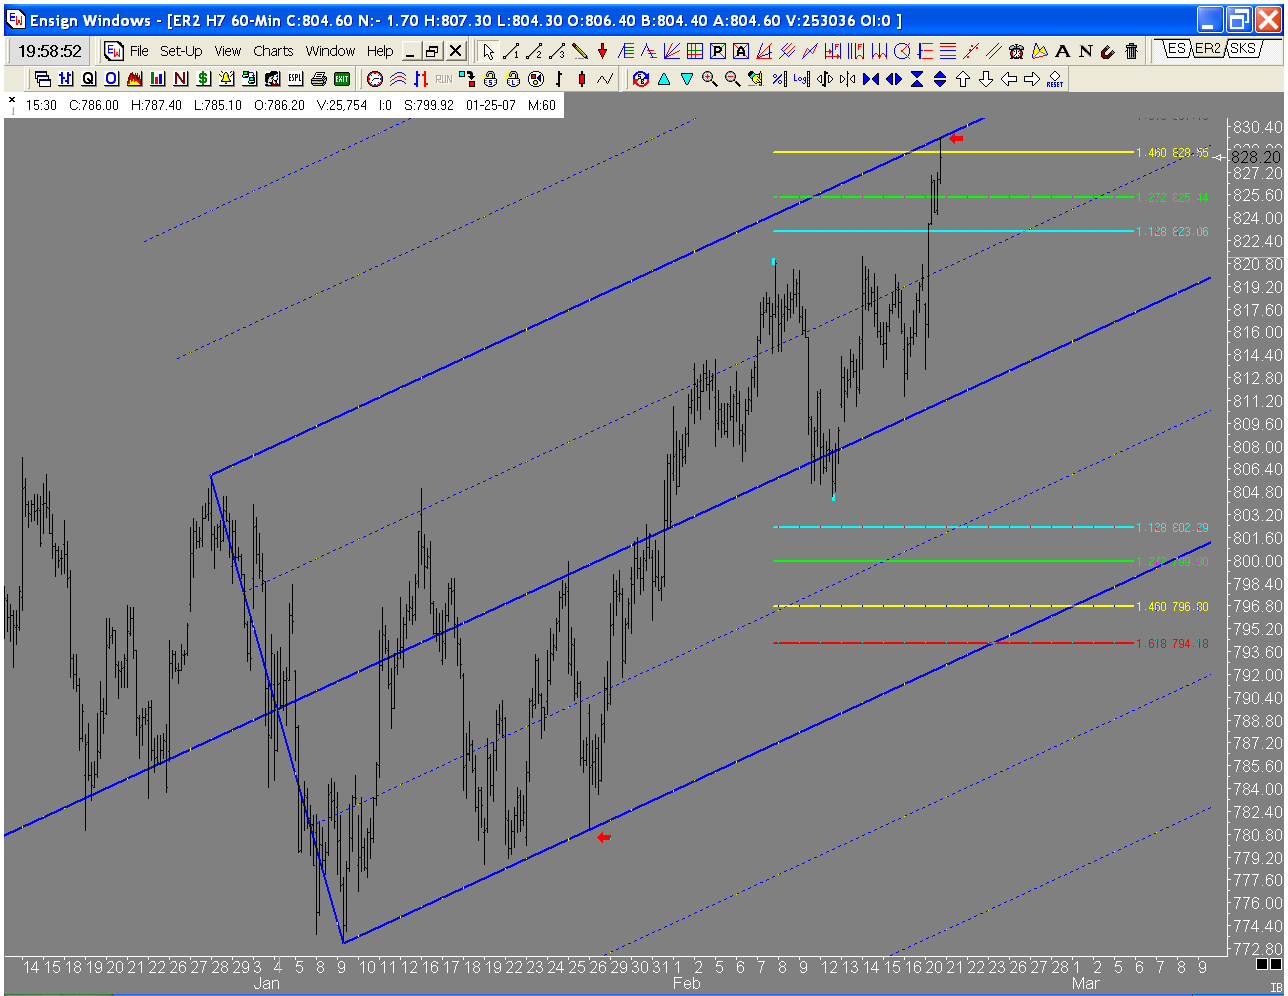
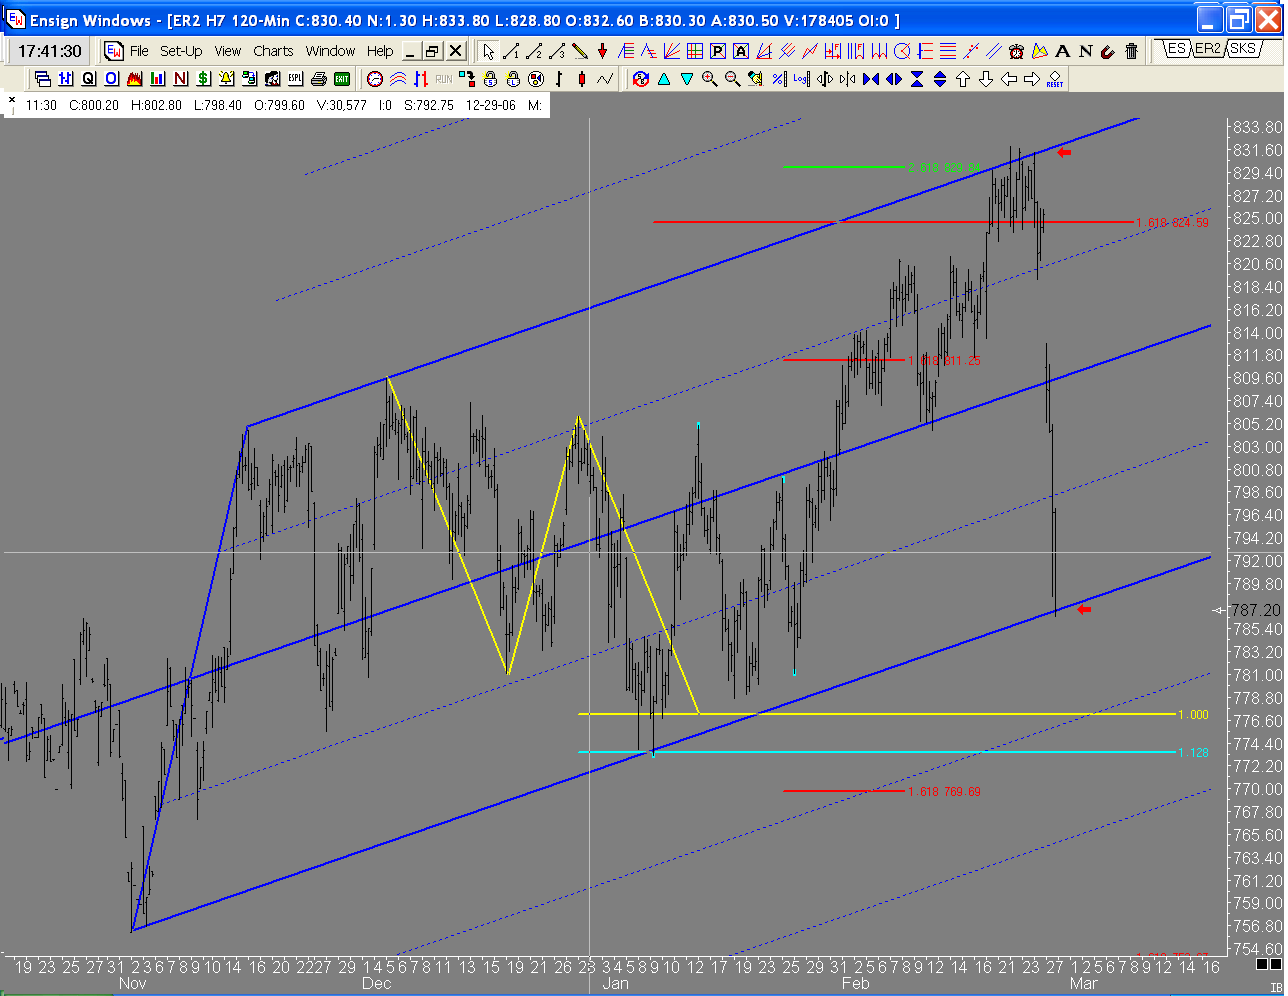
Reached the top of adjusted fork that was locked at lower arrow. Also the 1.460 extention that Geo was showing yesterday. Where will the markets go from here? Do I dare fade this Bull? I will heed the words of wisdom from JL. "To anticipate the market is to gamble; to be patient and react only when the market gives the signal is to speculate"


Click image for original size
No Description Entered
MR
mreiserer
Rep: 110
Posts: 2,220
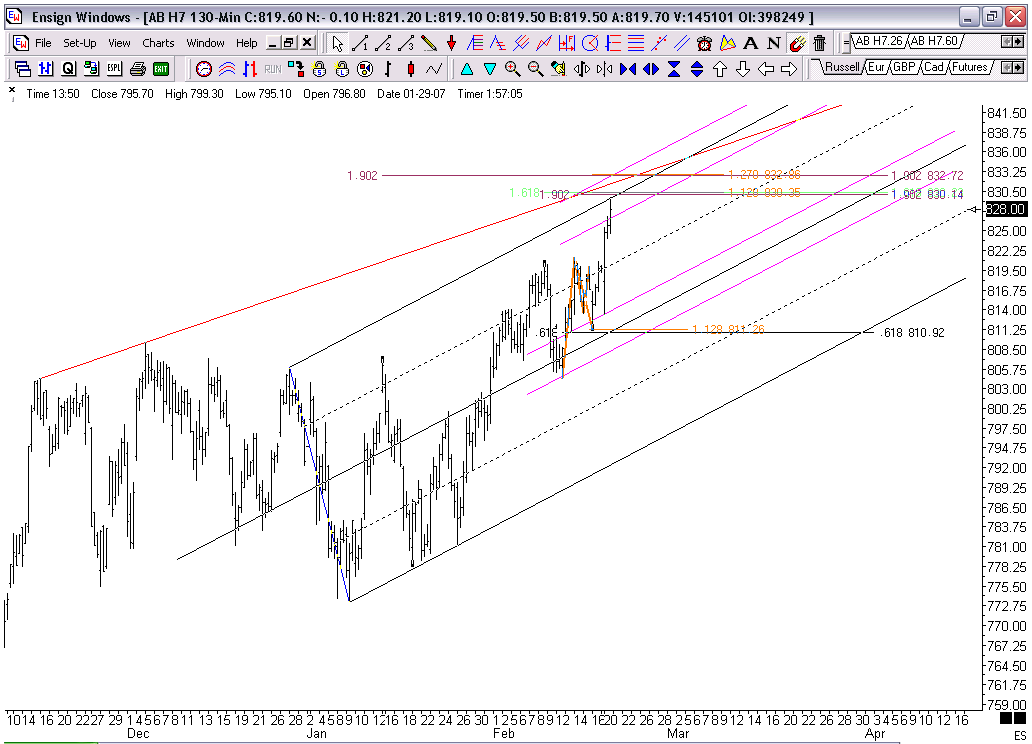
I find it interesting how this trendline from two previous highs comes right into this area. It may not mean anything and we won't know until price shows what it's doing.


Click image for original size
No Description Entered
JI
jimkane
Rep: 3,058
Posts: 33,089
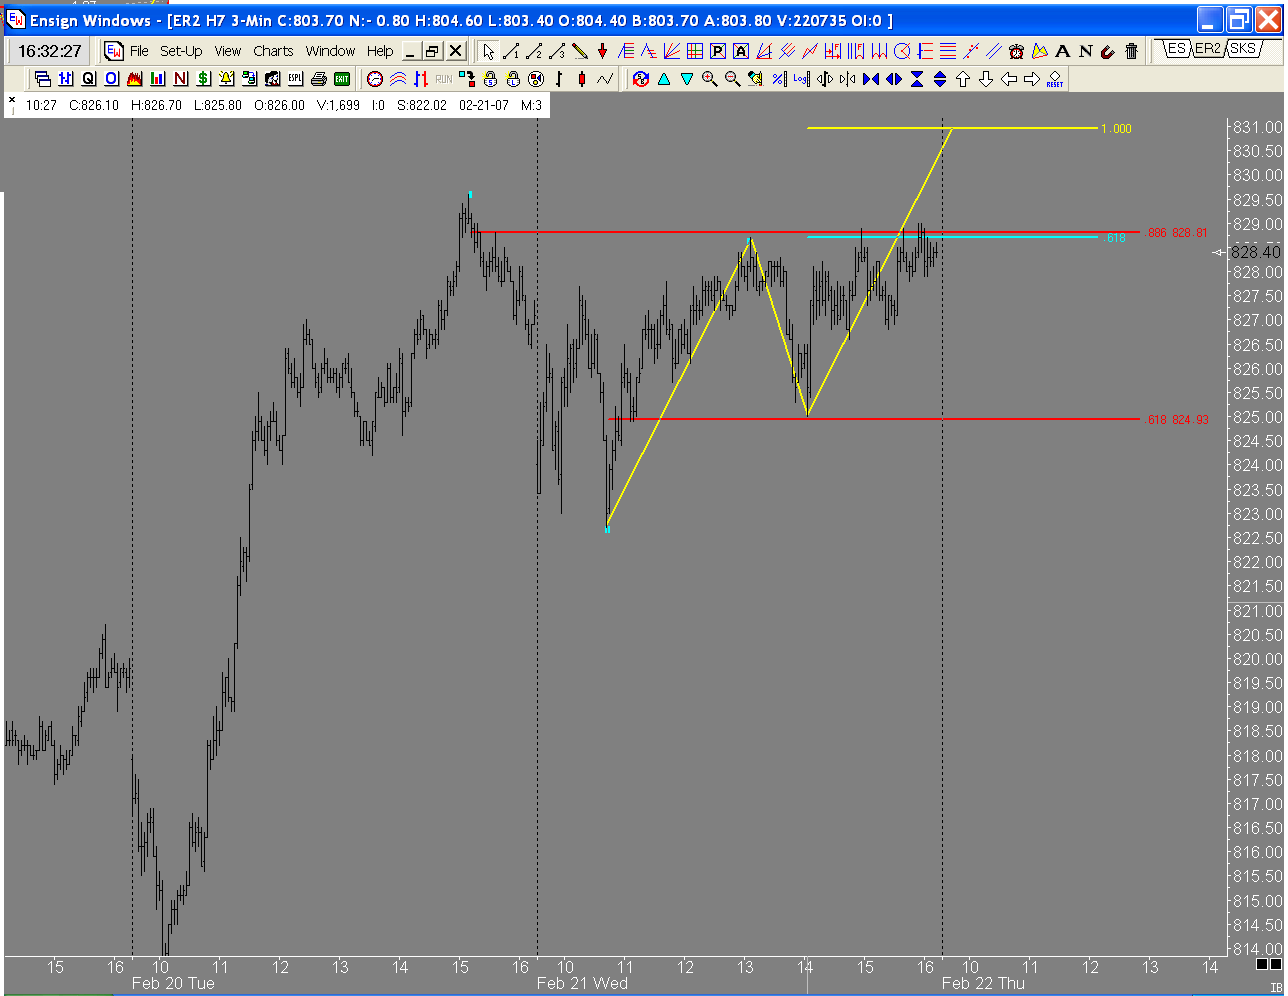
This is almost a classic 'wave 4 bounce setup' in the making. I'd prefer the 'wave 2' high lower than the 'X' point, or it would be just about perfect.
DU
Duane
Rep: 100
Posts: 1,095
Should be fun tommorrow!!


Click image for original size
No Description Entered
JI
jimkane
Rep: 3,058
Posts: 33,089
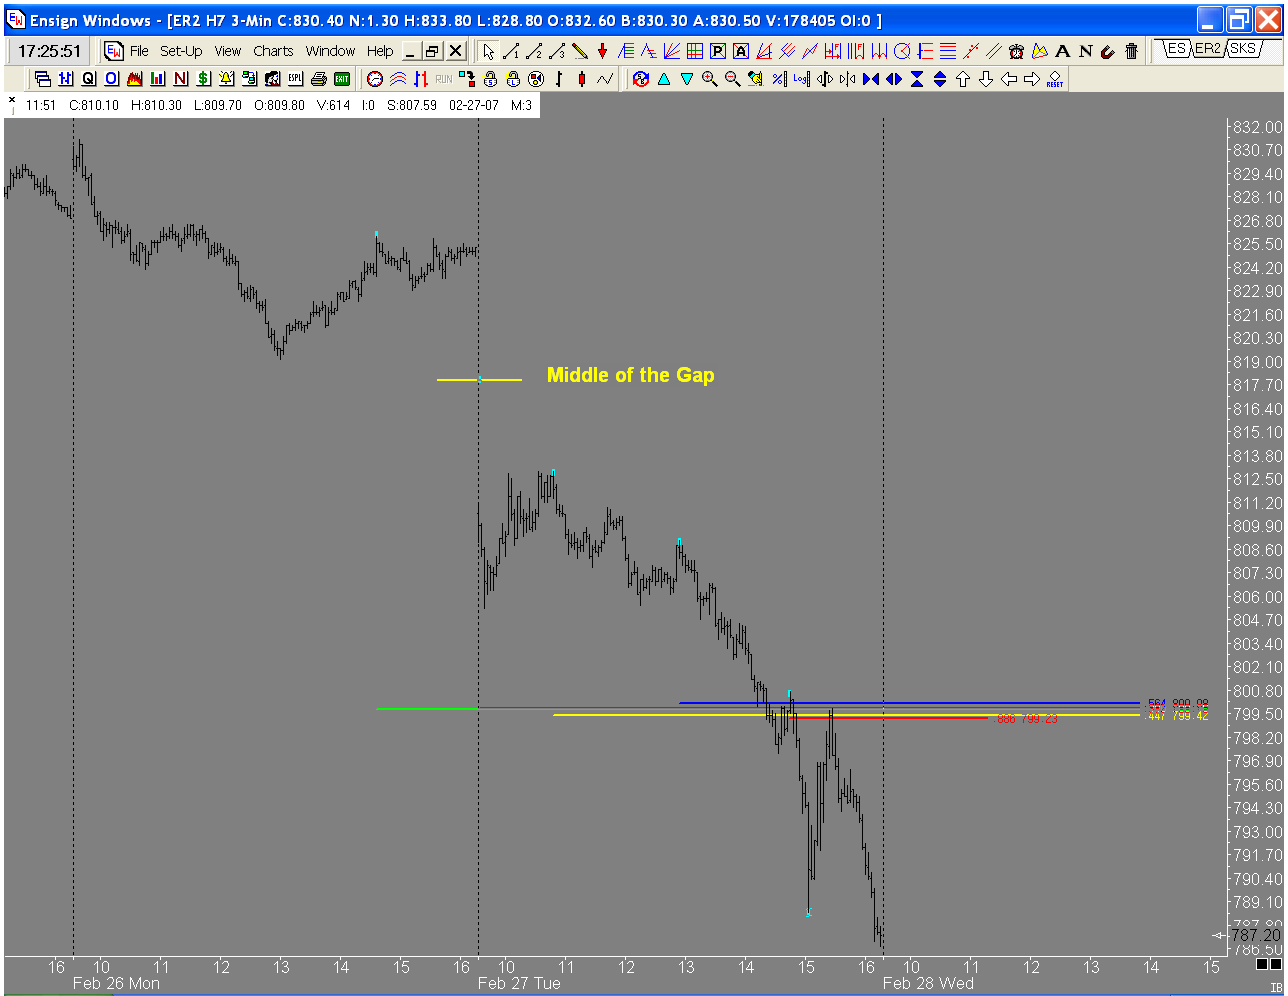
OK, Duane, homework time. It goes without saying, I think, that this was the best Russell day I have ever seen in my entire career. I suspect you will post the tick ABCD just a bit before a half-hour before the open that set all this up. But here's what I want you to post, too. Do a 3-minute chart, or whatever shows this best on a chart, and do a .300 off the swing-high right before yesterday's close, a .382 using Geo's famous middle of the gap (I used the closing price and the opening price), and a .447 off the B=D ABCD D point at around 10:45. Do these with the low at 15:00, and then look at what happened when this snap-bounced and rolled. I hope you all saw this 'real-time'. I think this will be informative for everyone. And yes, there is also a .564 and an .886 in there. Thanks, D, you are my Russell chart man.
DU
Duane
Rep: 100
Posts: 1,095
Harmonicity!!


Click image for original size
No Description Entered
DU
Duane
Rep: 100
Posts: 1,095
Kane Adjusted Forks call today's low. I have had this set on the chart for over a month!!

Click image for original size
No Description Entered
RO
roofer
Rep: 3,689
Posts: 3,574
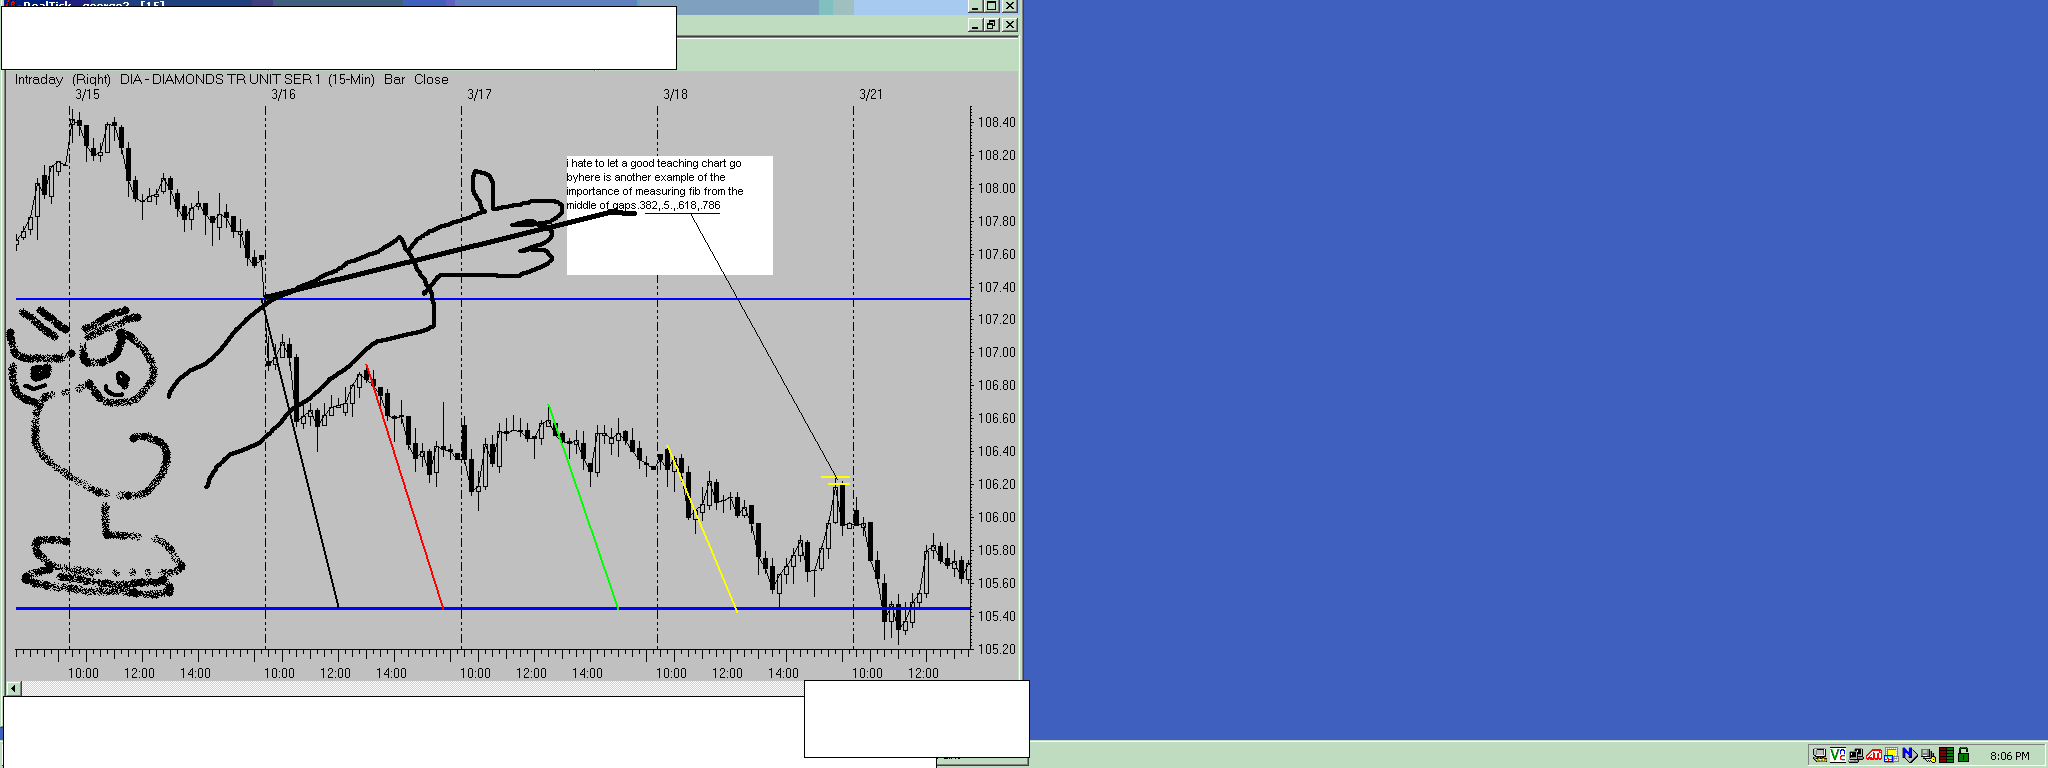
'' famous''' ha!ha!... thanks jim..but even though i have pounded the table on this for a number of years... i think you are the only one who has REALLY grasped the idea of the harmonicity of gaps and fib. here is a really old one from the archives... you''ll remember it from years ago!

Click image for original size
No Description Entered
JI
jimkane
Rep: 3,058
Posts: 33,089
You may be right about me being the only one, we can ask for input. I'm the only one I know, besides you, using it regularly, even if I don't discuss it much (don't want to take your credit). Hey, nice artwork, too.
RO
roofer
Rep: 3,689
Posts: 3,574
thankyou duane i knew it was back there somewhere...