Hi Jim,
Thanks for opening this Forum to your students and giving us an opportunity to show our charts and share our ideas.
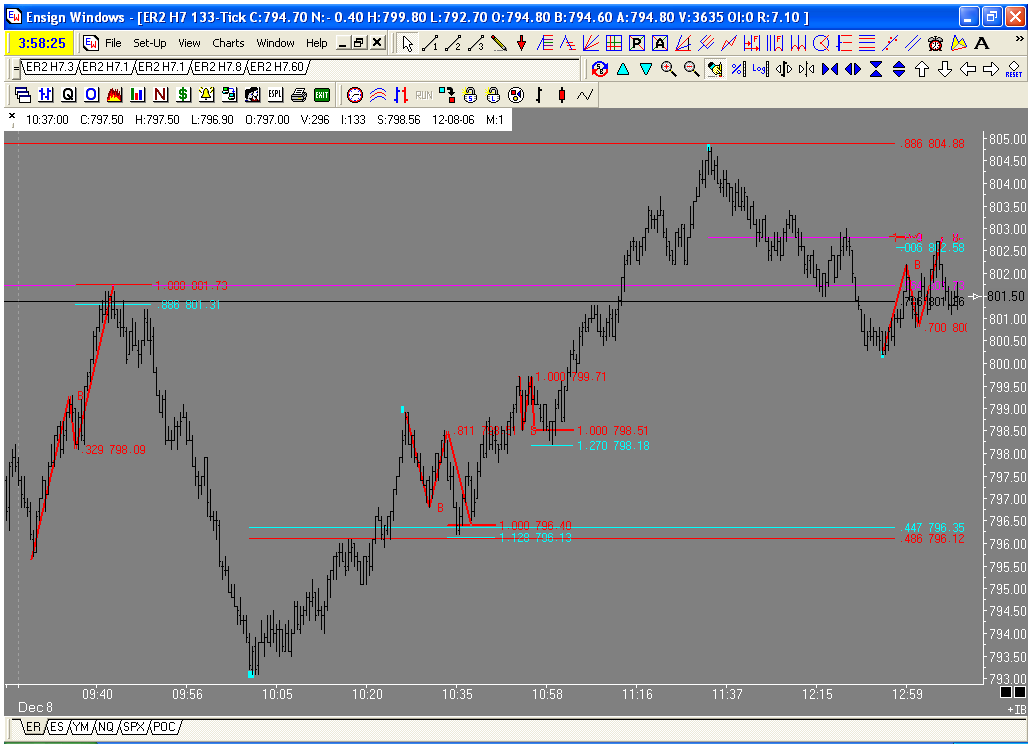
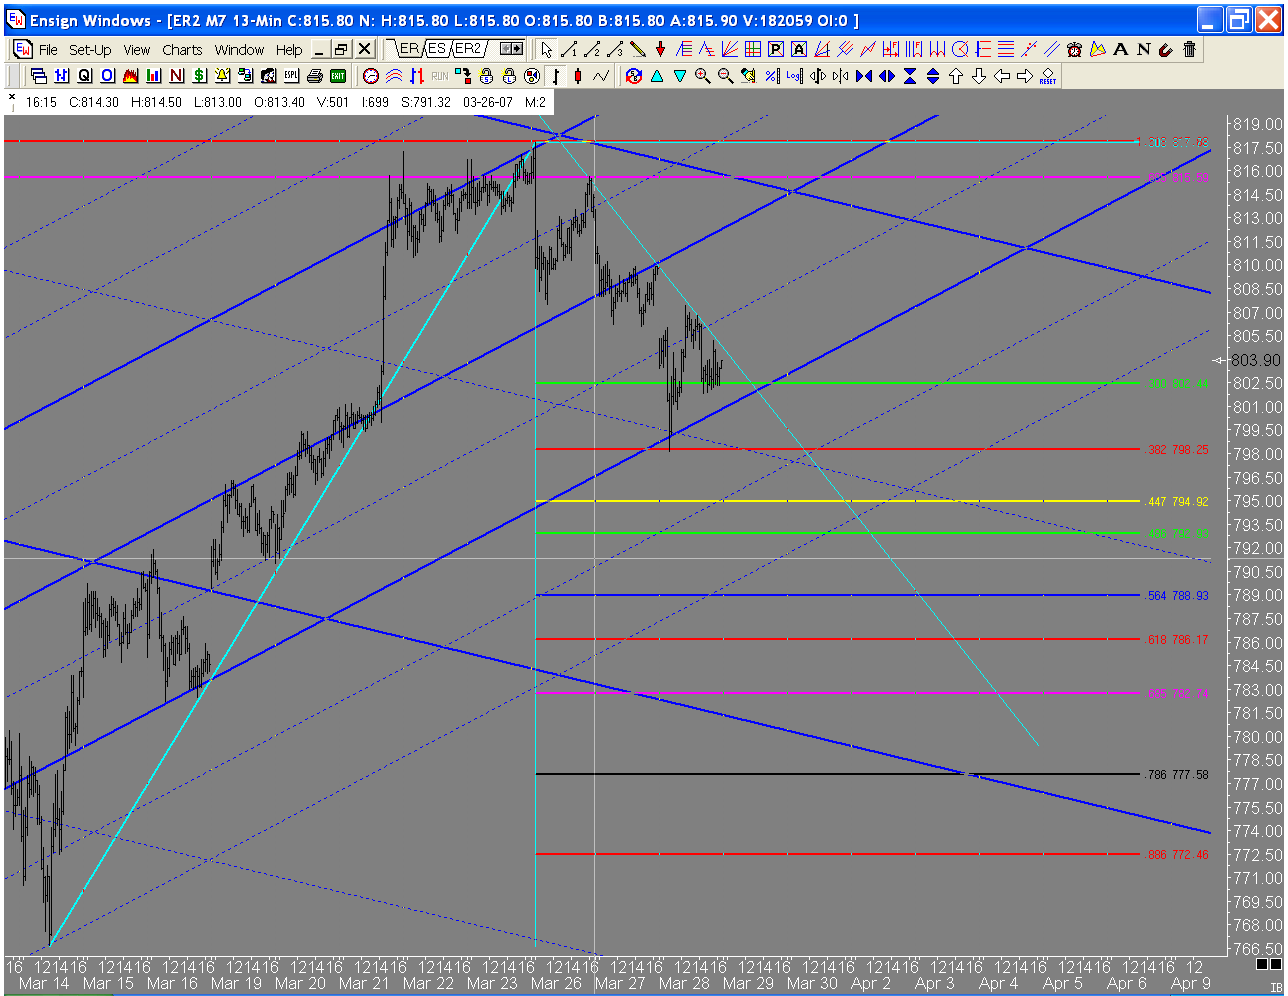
Here is a chart of todays ABCD's in the russell. I will post a context chart later. Today was one of those days where the market changes direction on Jim's unique Fib numbers, Had you been trading with standard fib numbers you may not have noticed these PTA's. Is it me or is .564 becomming more and more prevalent?
JI
jimkane
Rep: 3,058
Posts: 33,089
quote:
Originally posted by jimkane
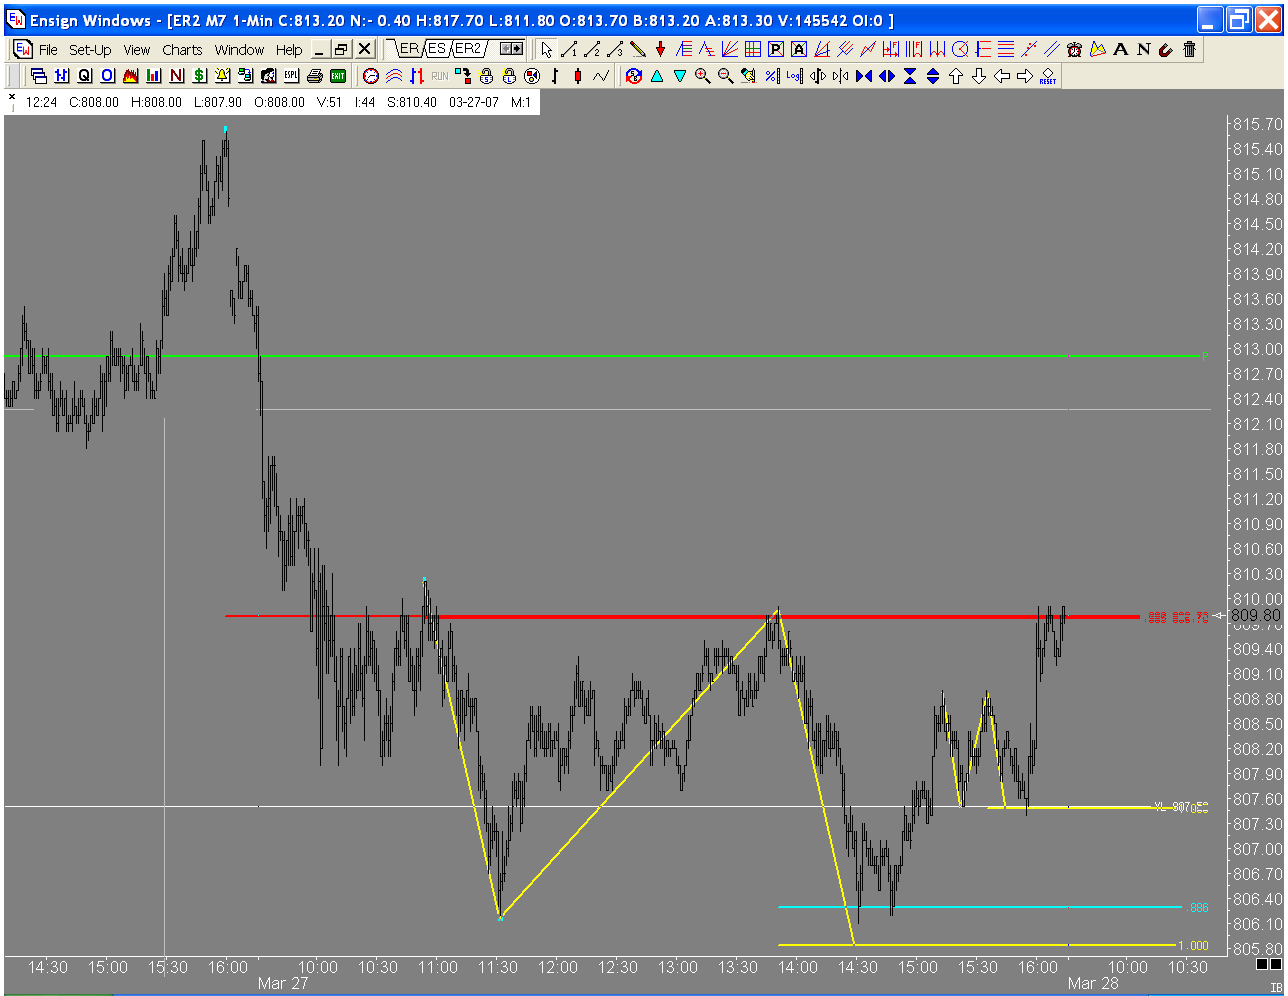
Watch the 10 area, if it gets there. Looks like it may not even make it back to there, though, the way it's acting right now. But you never know when a PPT, 'manipulation ramper' robot drone may attack, and squirt it up to new highs...
Hmmm, hit 9.90 and dropped. I guess that's why I said 'area', I can't always hit them right to the exact tick :-)
JI
jimkane
Rep: 3,058
Posts: 33,089
That .886 ABCD is a tough nut to crack, but now a flat ABCD at a .382 sits right on top of it. It sure looks like it wants to explode up, though. I guess with all the manipulators and the quarter end, this thing has no chance to really go down. Same story, different day. But that was a sweet 3.8 point, smooth tick chart move for me off that 9.90. I can't ask for more than that.
JI
jimkane
Rep: 3,058
Posts: 33,089
And look now! Flat ABCD prevails, and deeper ABCD hit. Now a 4-Point, and then an ABCD. Nice aftermarket action.
JI
jimkane
Rep: 3,058
Posts: 33,089
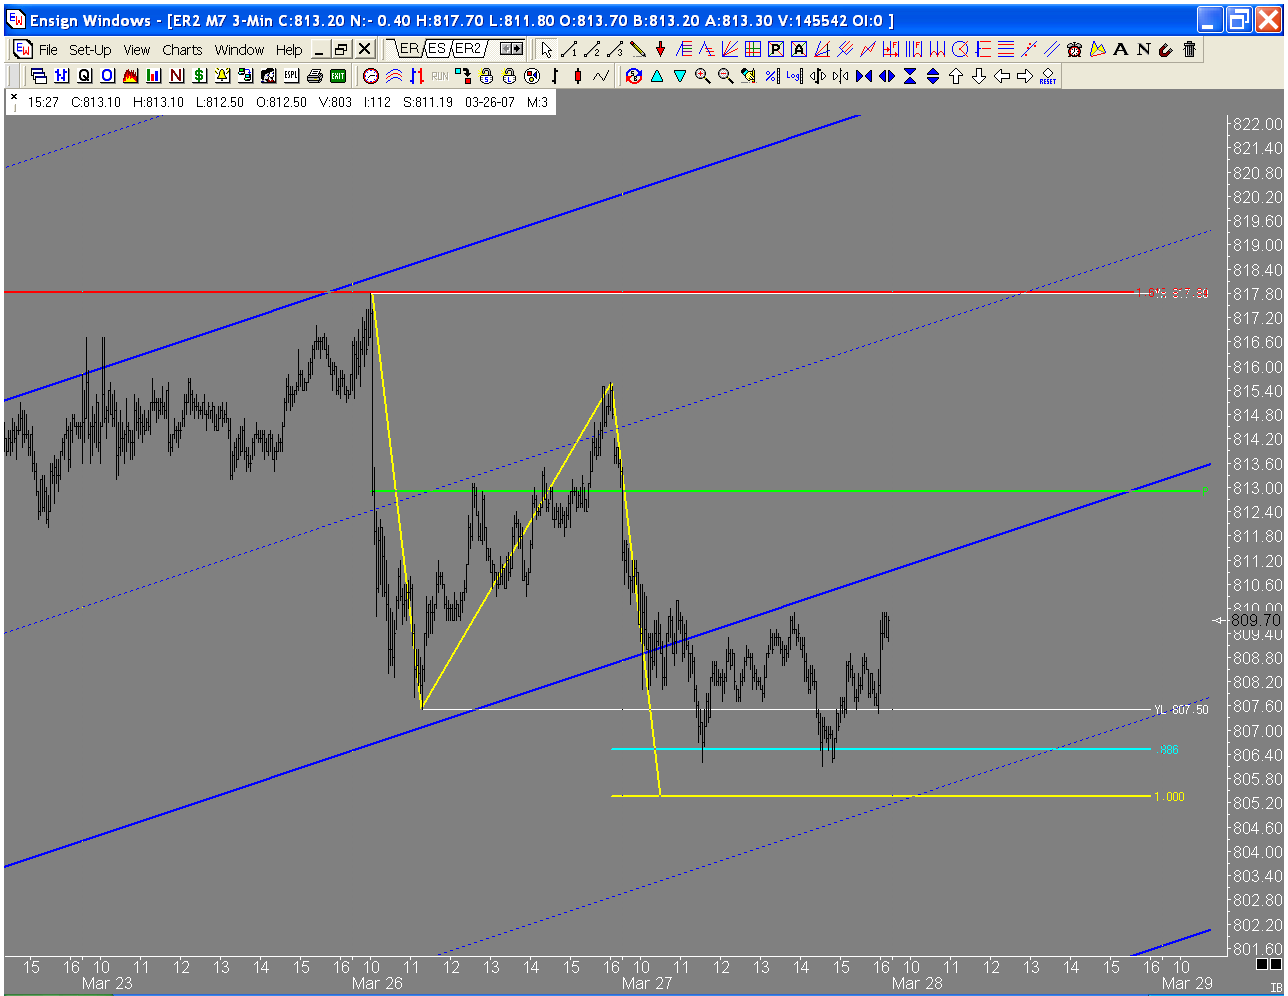
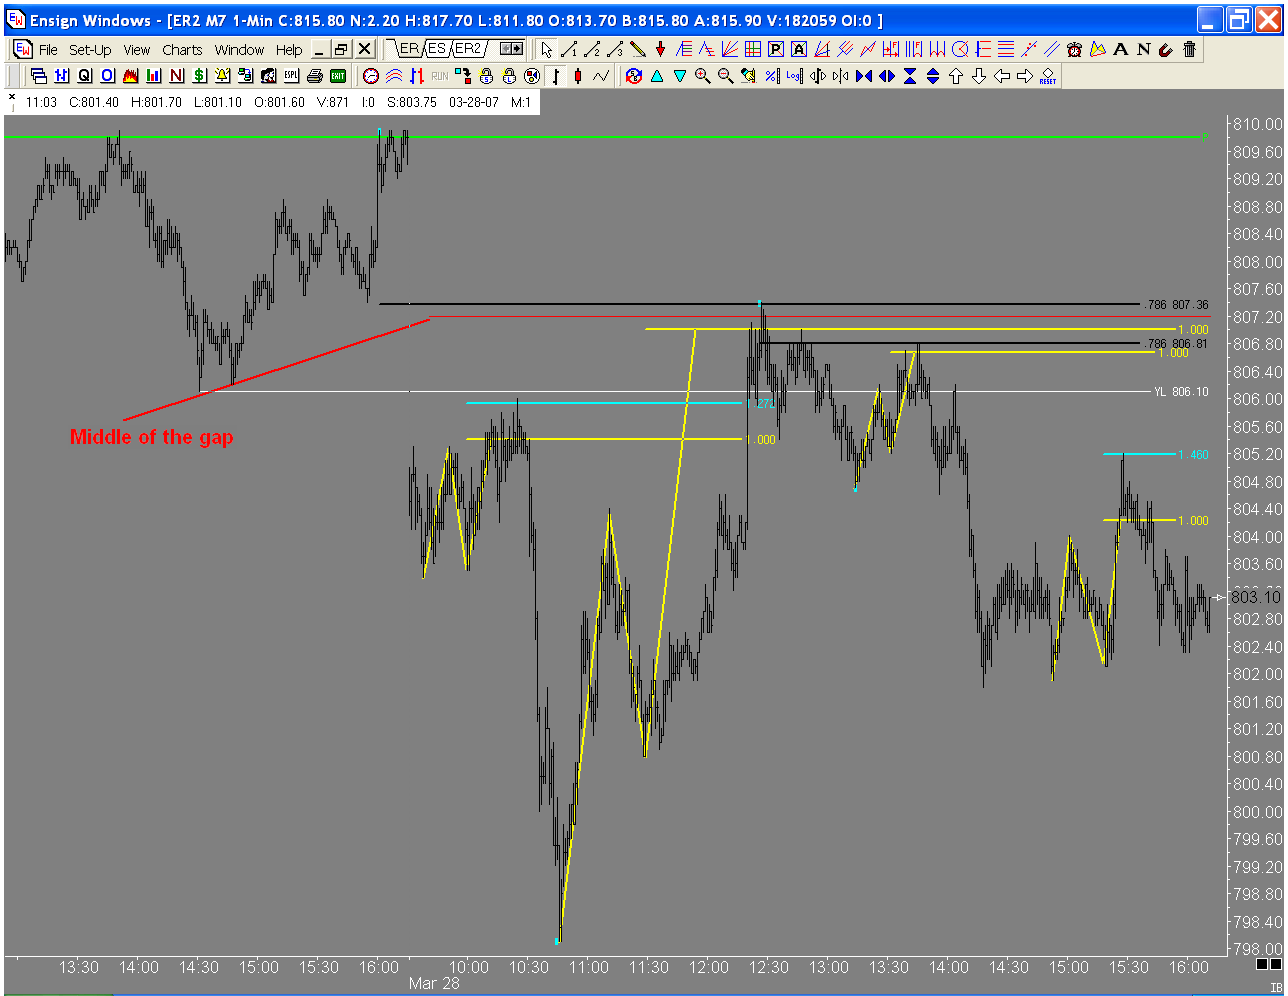
OK, go back to when that 4-Point sold off on the 16th, and see what it did when it didn't follow through, how it looked, in terms of the layout by day's end and such. Now look at the ABCD from today that also produced a reaction, and what it has done since, and where it ended the day. See the pattern? Not one of the usual patterns, but a pattern of price action and a 'layout'. It is one I've seen many times, but never discussed. Here is a good example to look back and compare, and see if it does the same thing, or not. Many do. I'm hoping this is something you will be able to see, but don't fret if you don't, it's not an easy thing with no more clues than I've given.
MR
mreiserer
Rep: 110
Posts: 2,220
It's interesting how today's current high is right at yesterday's Pivot
JI
jimkane
Rep: 3,058
Posts: 33,089
Yes, it is something I see frequently. I also see the previous highs and lows being used, too. But I have to be careful not to get too much on my charts, or I'll get analysis paralysis.
Did you notice it followed the pattern I hinted at above? I'm surprised I didn't get any comments on that. I'm not going to describe this, you guys all need to do the work to try to figure this out, if you think it's worth it.