Hi Jim,
Thanks for opening this Forum to your students and giving us an opportunity to show our charts and share our ideas.
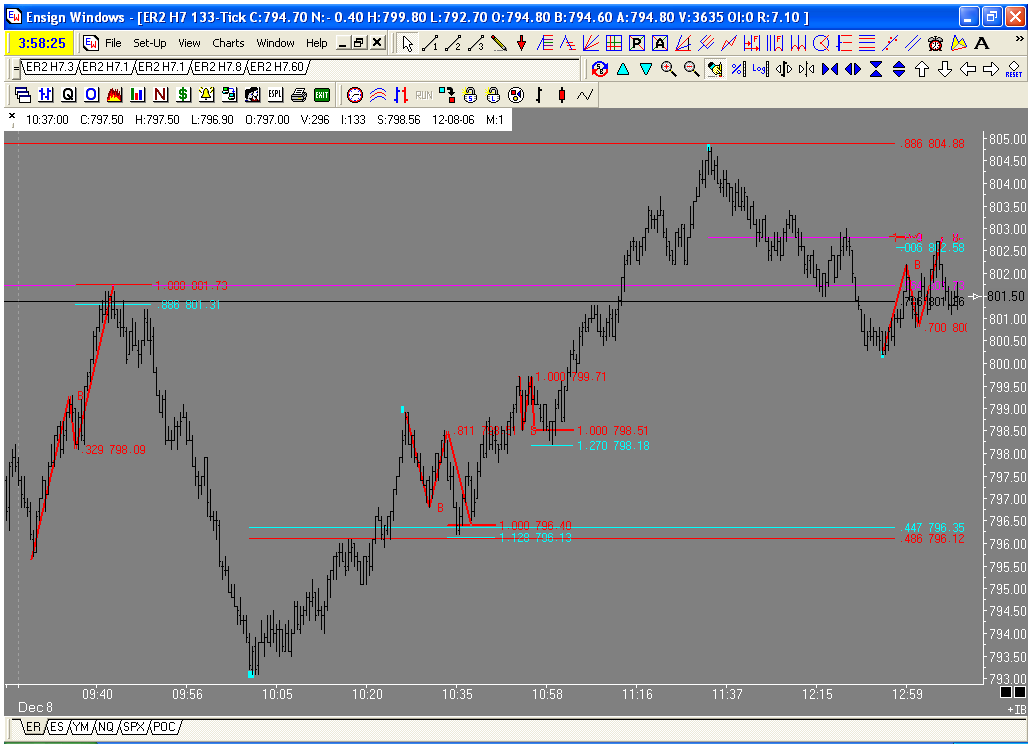
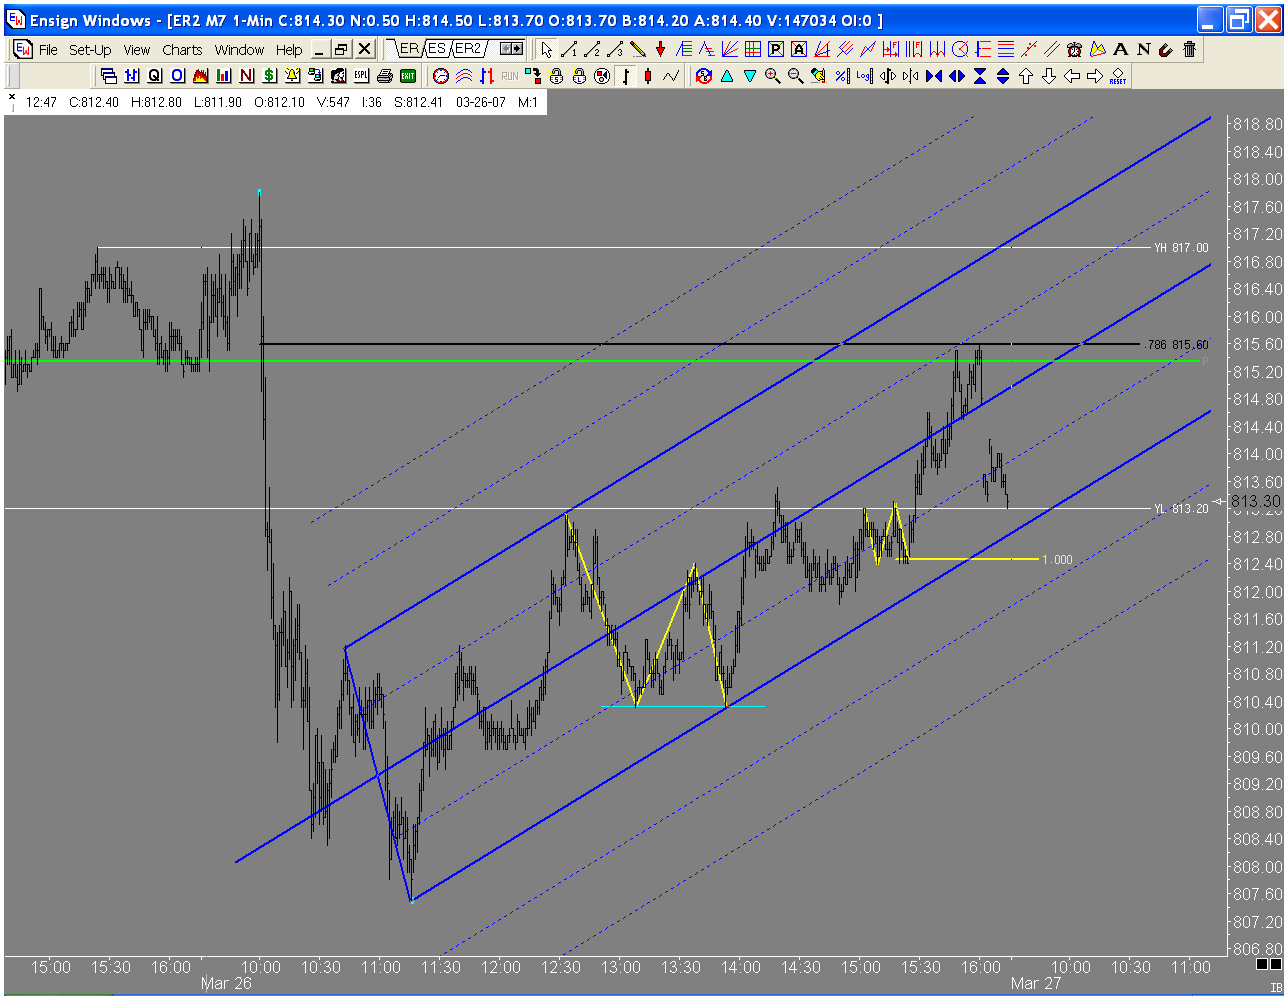
Here is a chart of todays ABCD's in the russell. I will post a context chart later. Today was one of those days where the market changes direction on Jim's unique Fib numbers, Had you been trading with standard fib numbers you may not have noticed these PTA's. Is it me or is .564 becomming more and more prevalent?
JI
jimkane
Rep: 3,058
Posts: 33,089
Is Geo getting ready to draw some boxes? They just can't let it go yet...
JI
jimkane
Rep: 3,058
Posts: 33,089
I'll post a really cool chart later, showing one of the ways I answer a question on ABCD's.
JI
jimkane
Rep: 3,058
Posts: 33,089
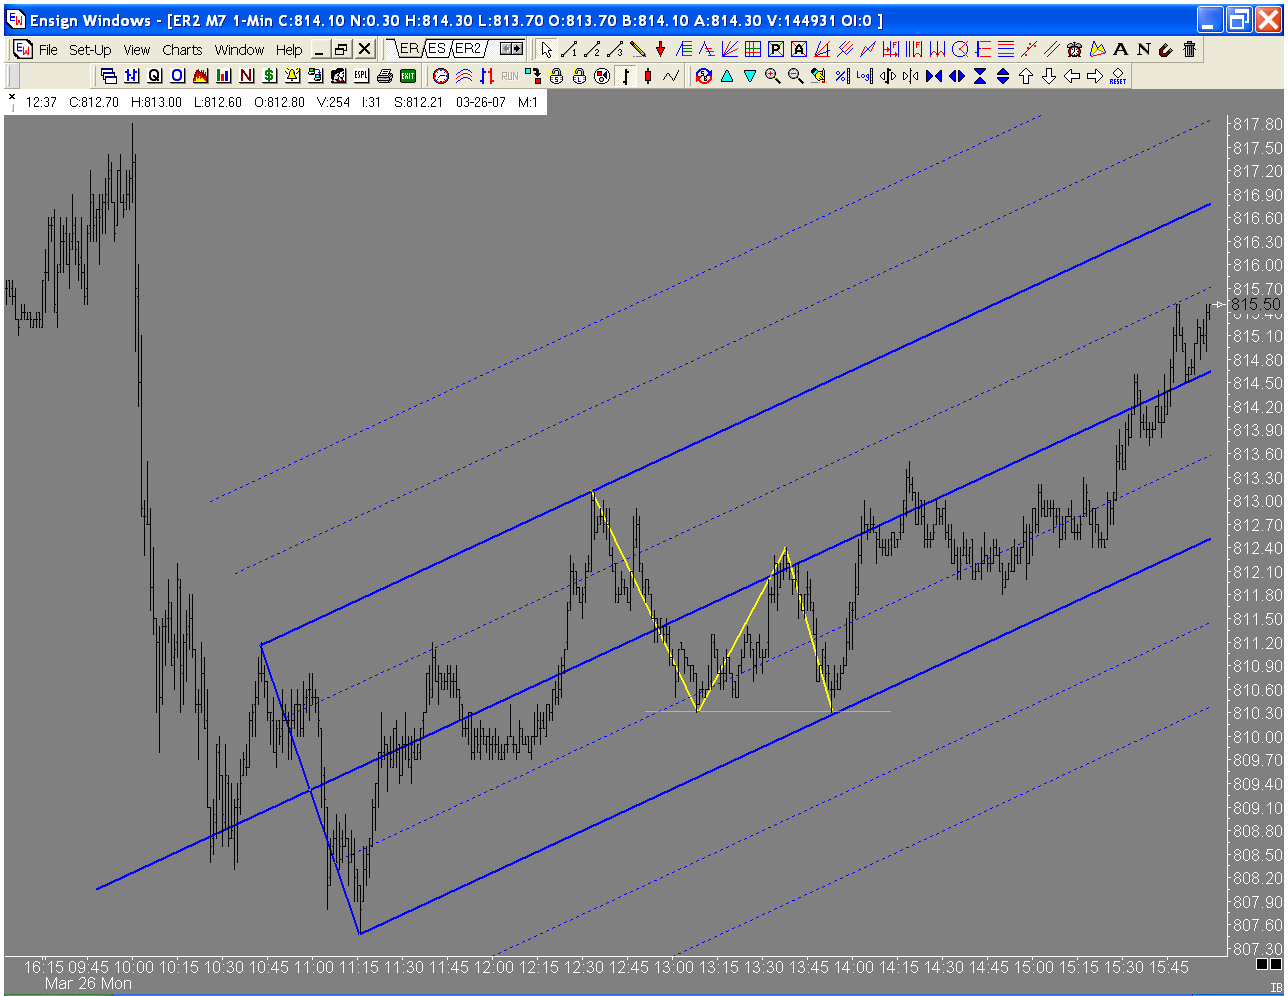
Stealing my thunder, Duane... But, you saved me the chart work. I'll just do the explanation. I get asked a lot, and I work on this a lot in mentorships, how I decide which ABCD to focus on, once I add in all the 'newer' variations, on top of the 'new' ones, and the old ones. I see, first, what the lines tell me. Here we have a B=D ABCD, and the line tells me to be on the lookout right there.
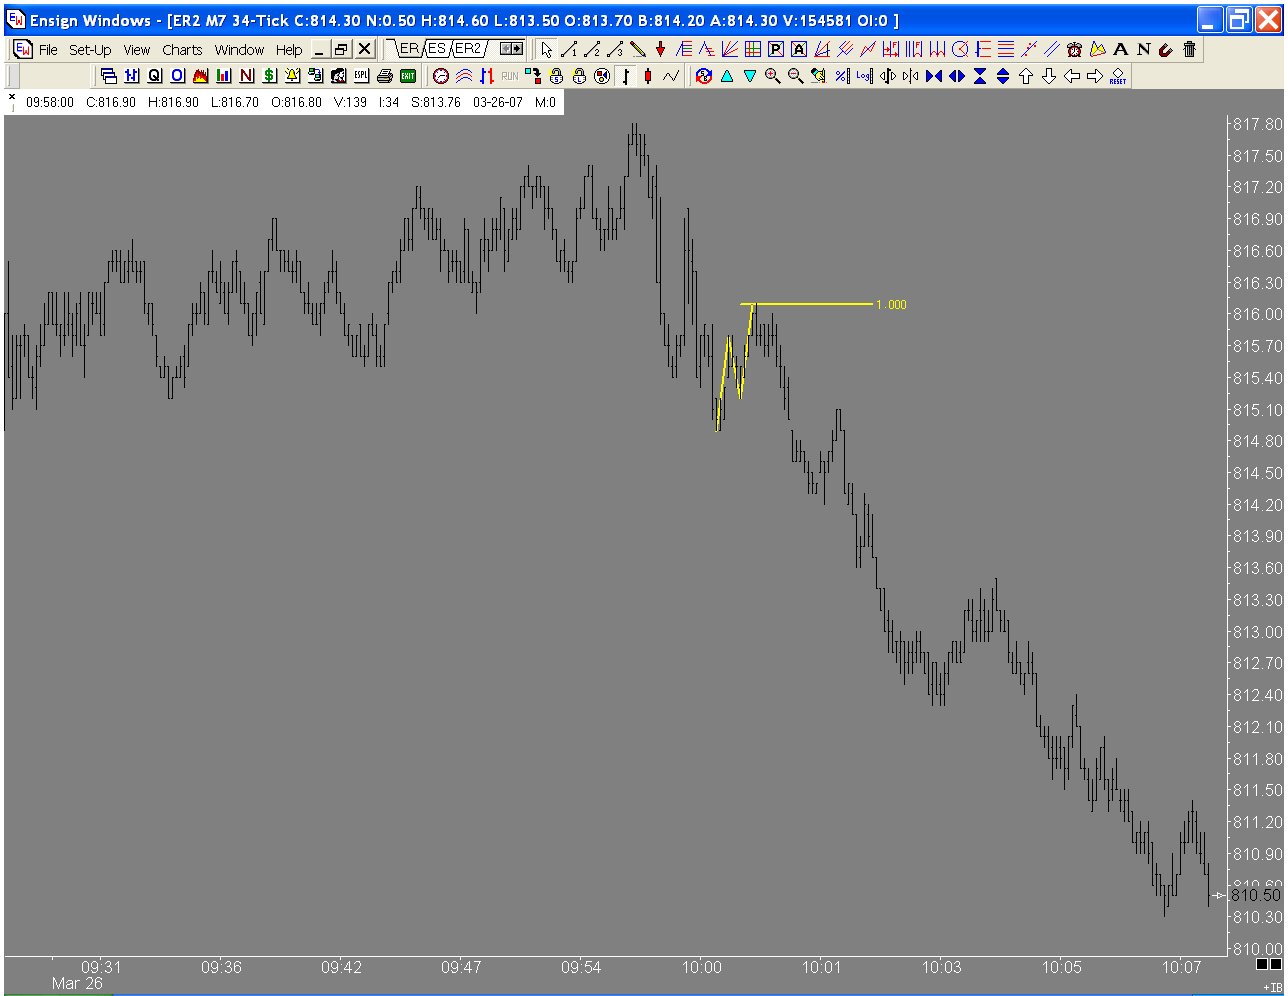
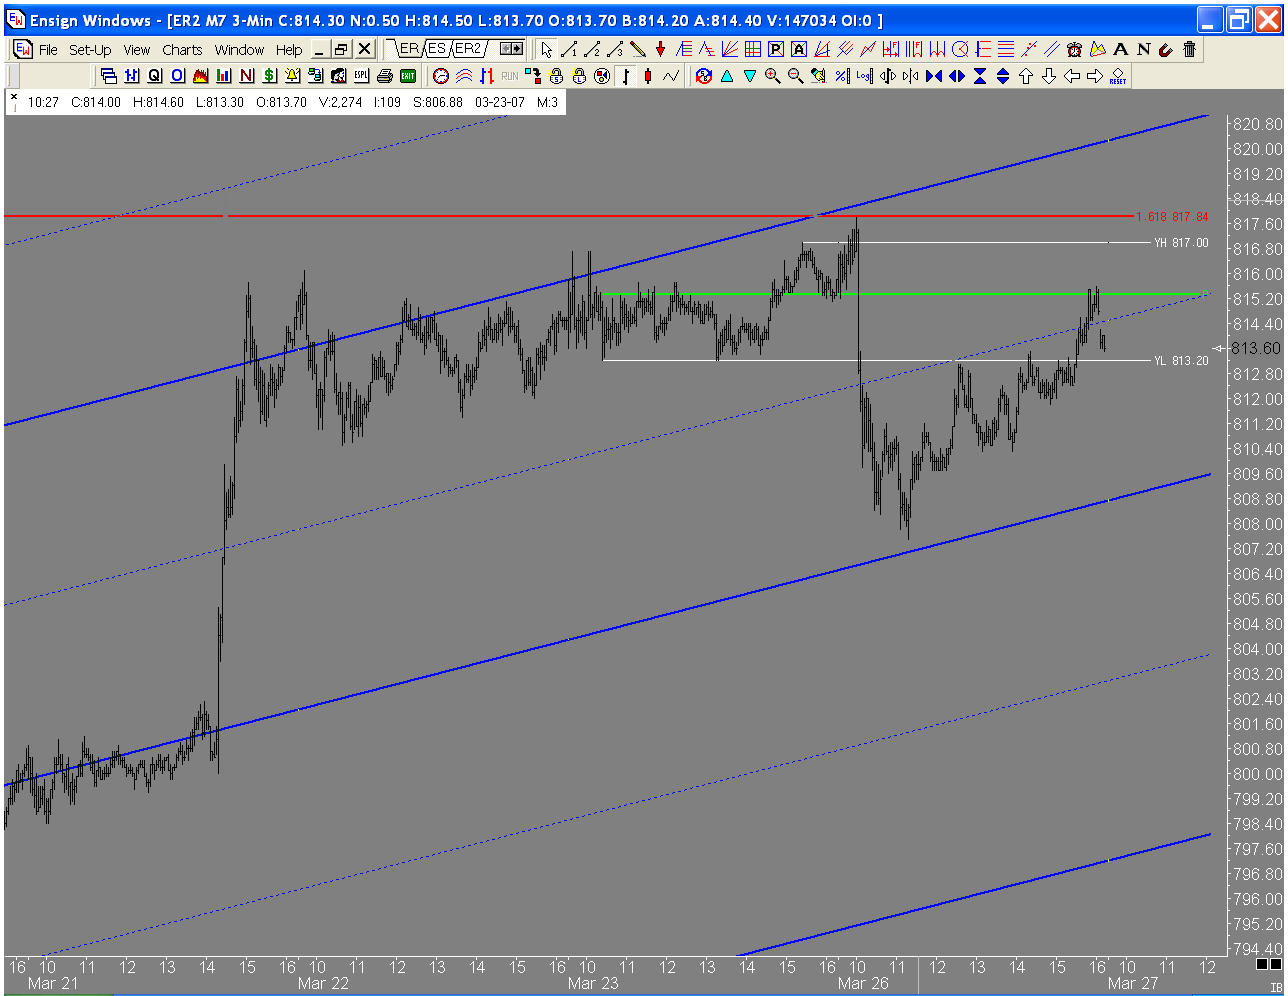
Now, you can add a few things onto this chart for me, Duane, to add a little more information. Put on a line for Friday's low, the pivot (hlc/3, RTH), and a .786 from the 'drop zone'. Notice how it tried four times to get above the low, finally launching off a small flat ABCD. Notice the upper division line, pivot, and .786 area, and not only how clear it was, but how the Russell acted in that area (please show all the data until the futures close at 16:15). And finally, if you want to to do another chart, do a 34-tick chart showing when this finally broke down this AM. Keep in mind we had a key area we were watching right there, and recall my OIH post. Notice that this wasn't as 'straight down' as a 1-min chart implied. If you saw this come together, knew the report was due out, and just watched the initial reaction, it gave you a chance.
DU
Duane
Rep: 100
Posts: 1,095
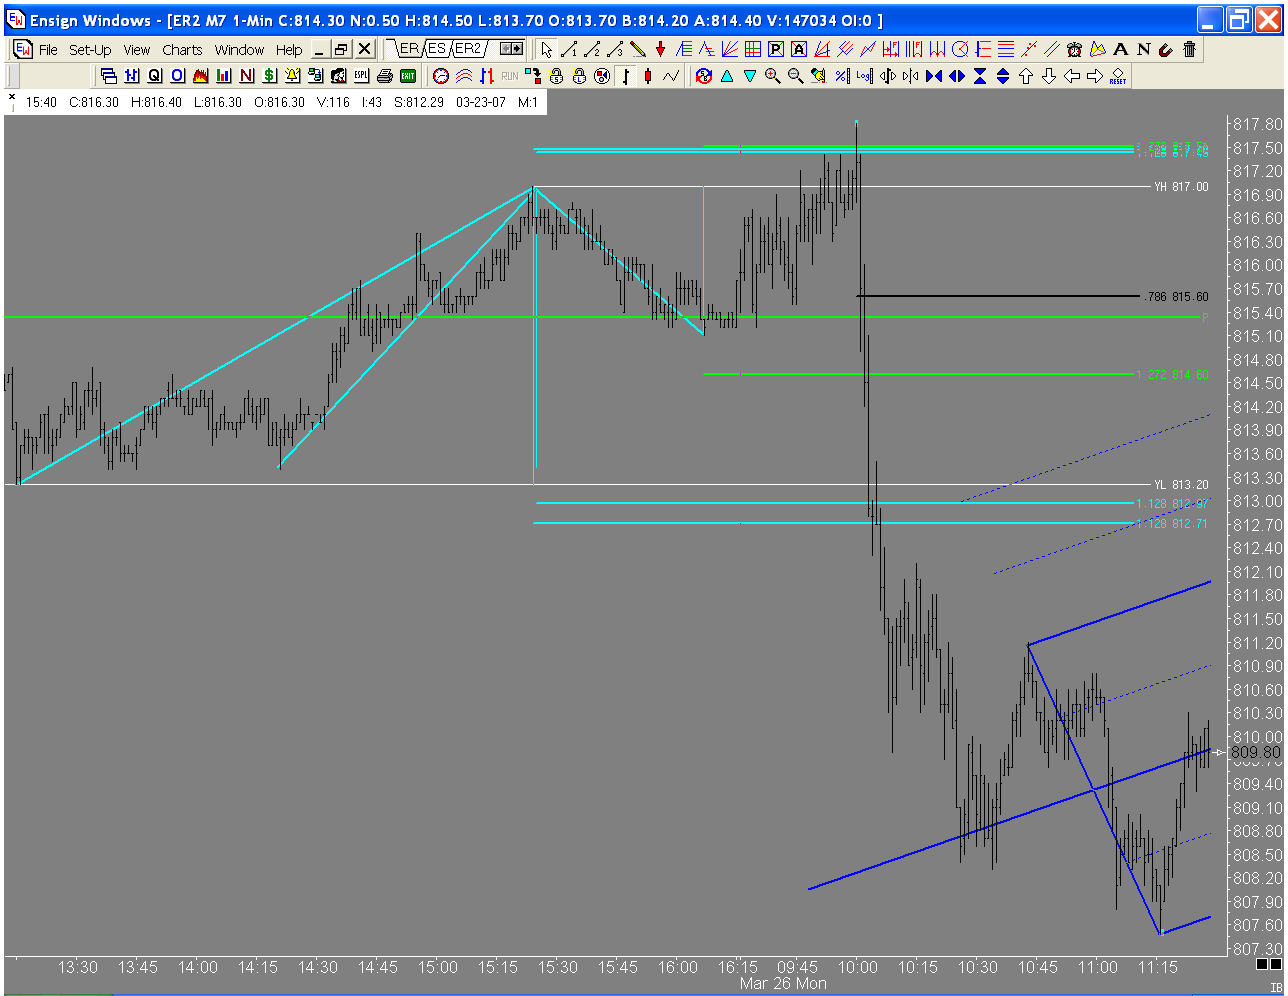
Sorry, I was in a bit of a hurry earlier. I left out this vital bit on information that Jim alluded to, the 1.128 "stop run" .
From Jim's commentary:
I pulled off the main retracement, as mentioned above, but I left the key median line upper parallel, and two 1.128 'stop runs'. Now, sure, this may be a coincidence, but just as the area was hit the announcement comes out. Even if there was nothing to that, at the least the timing is such that I can expect a potentially violent reaction. Bear in mind my thinking as this set up was a reaction off the area, and then a push through.
JI
jimkane
Rep: 3,058
Posts: 33,089
They love to shake out the suckers... Can't have suckers making money, after all.