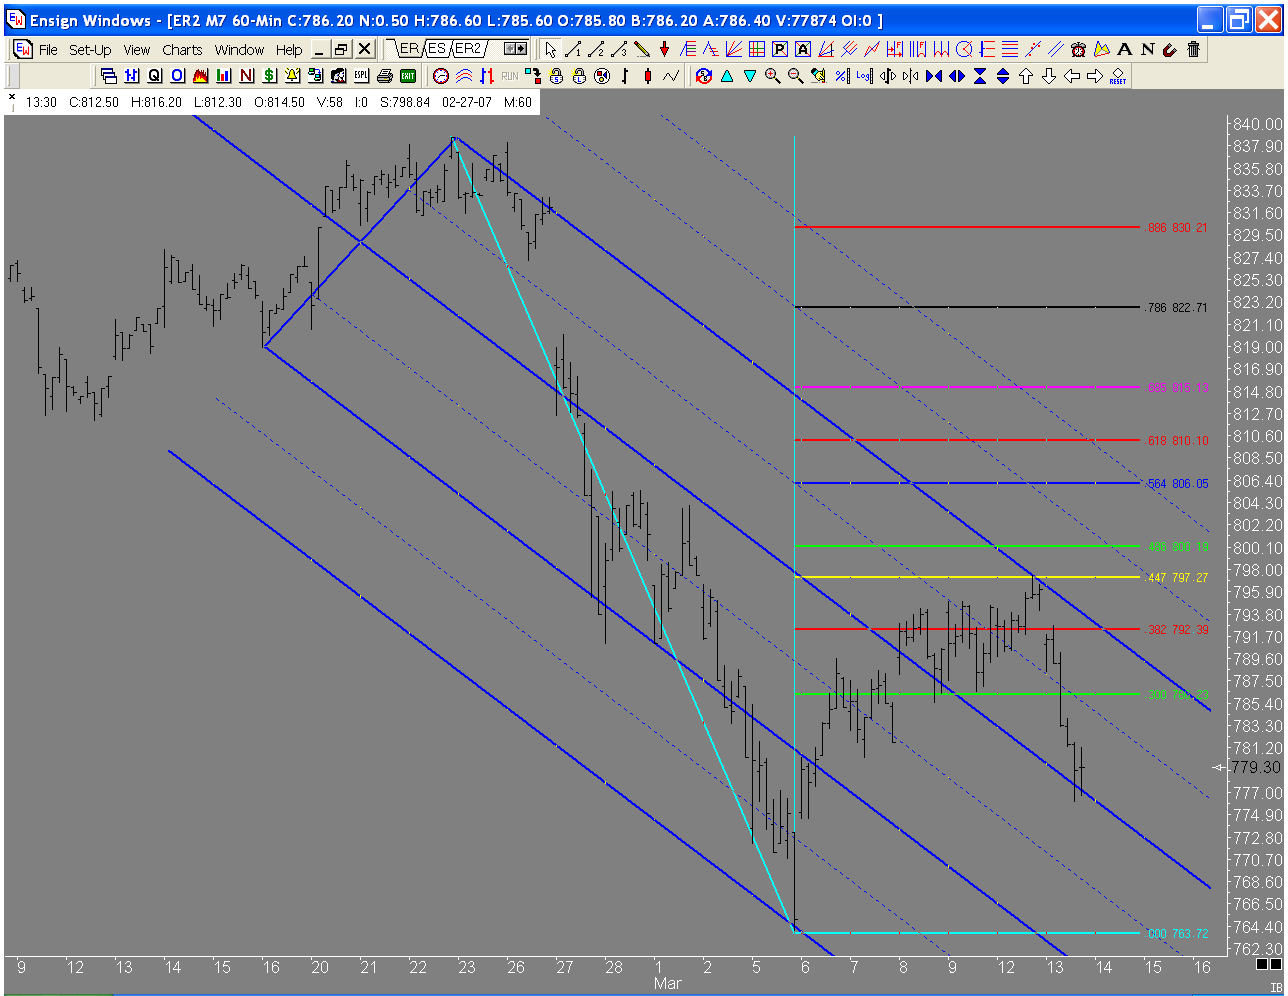
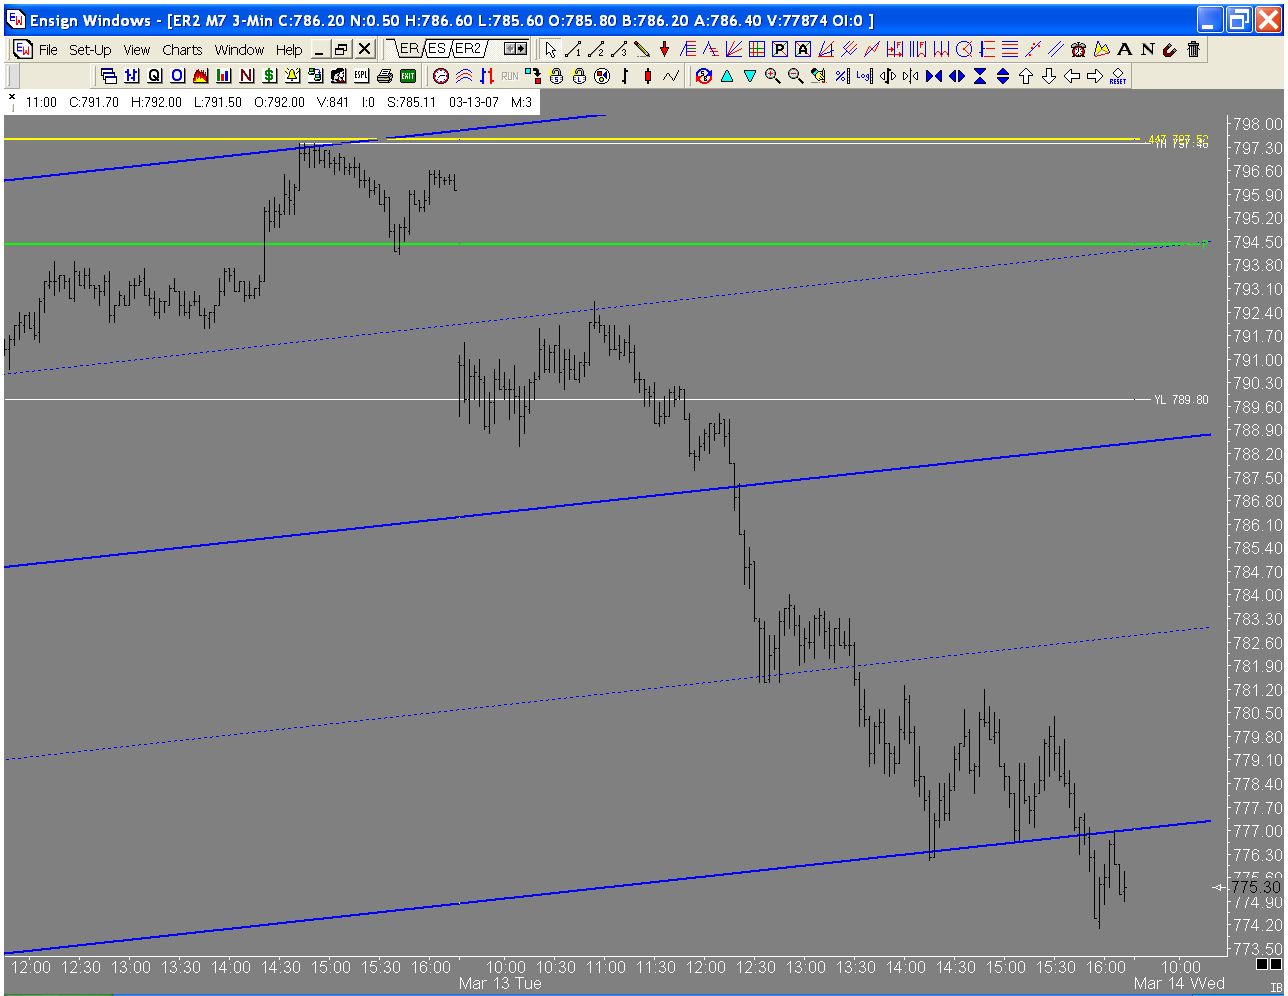
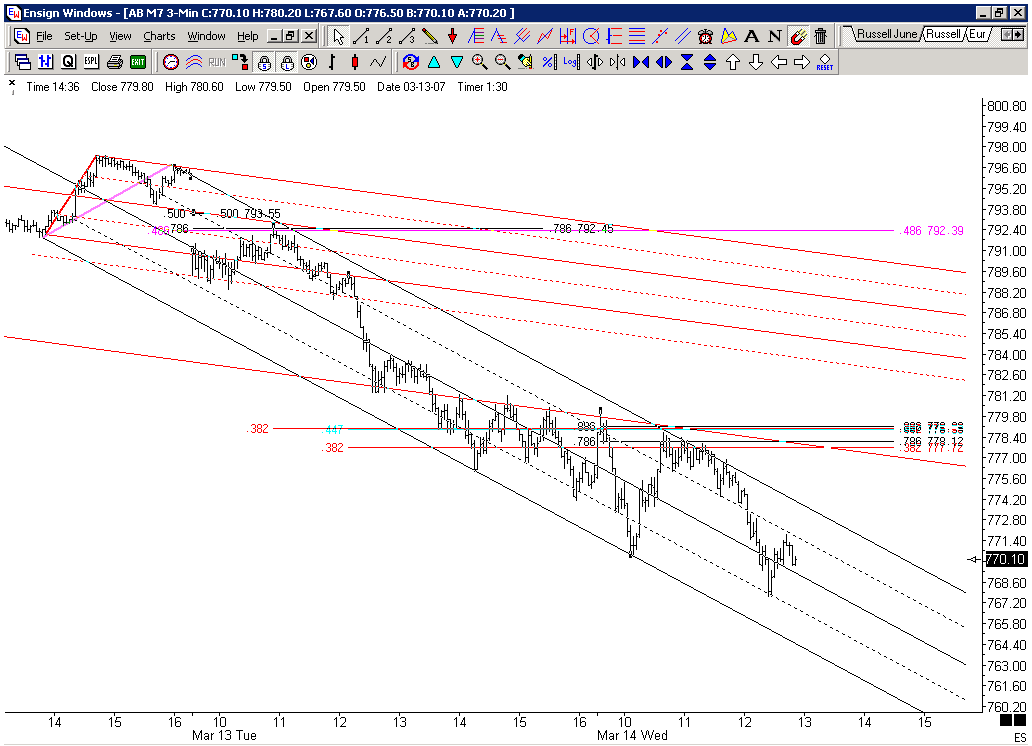
Hi Jim,
Thanks for opening this Forum to your students and giving us an opportunity to show our charts and share our ideas.
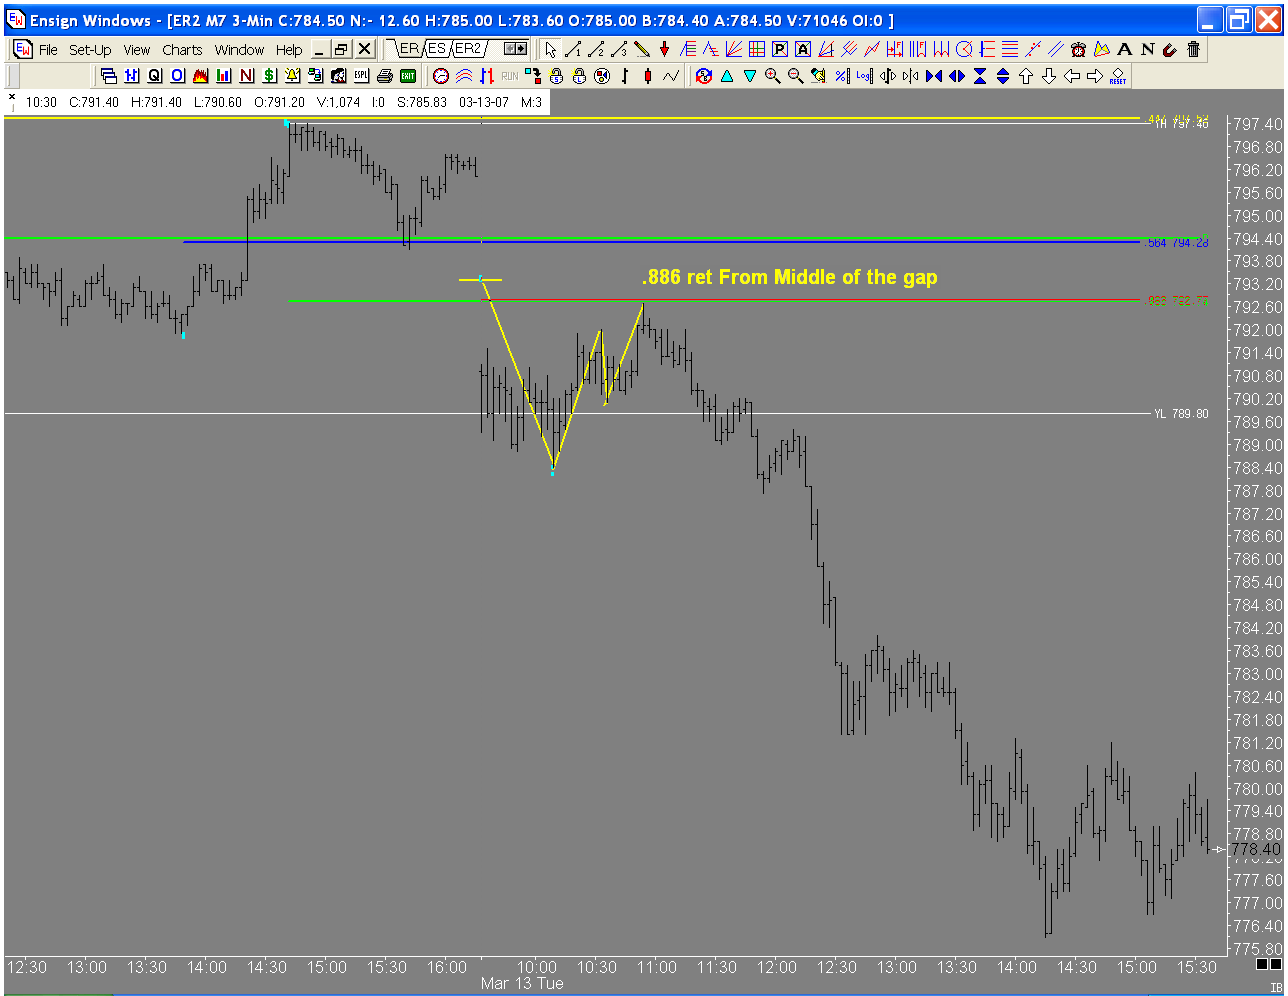
Here is a chart of todays ABCD's in the russell. I will post a context chart later. Today was one of those days where the market changes direction on Jim's unique Fib numbers, Had you been trading with standard fib numbers you may not have noticed these PTA's. Is it me or is .564 becomming more and more prevalent?
JI
jimkane
Rep: 3,058
Posts: 33,089
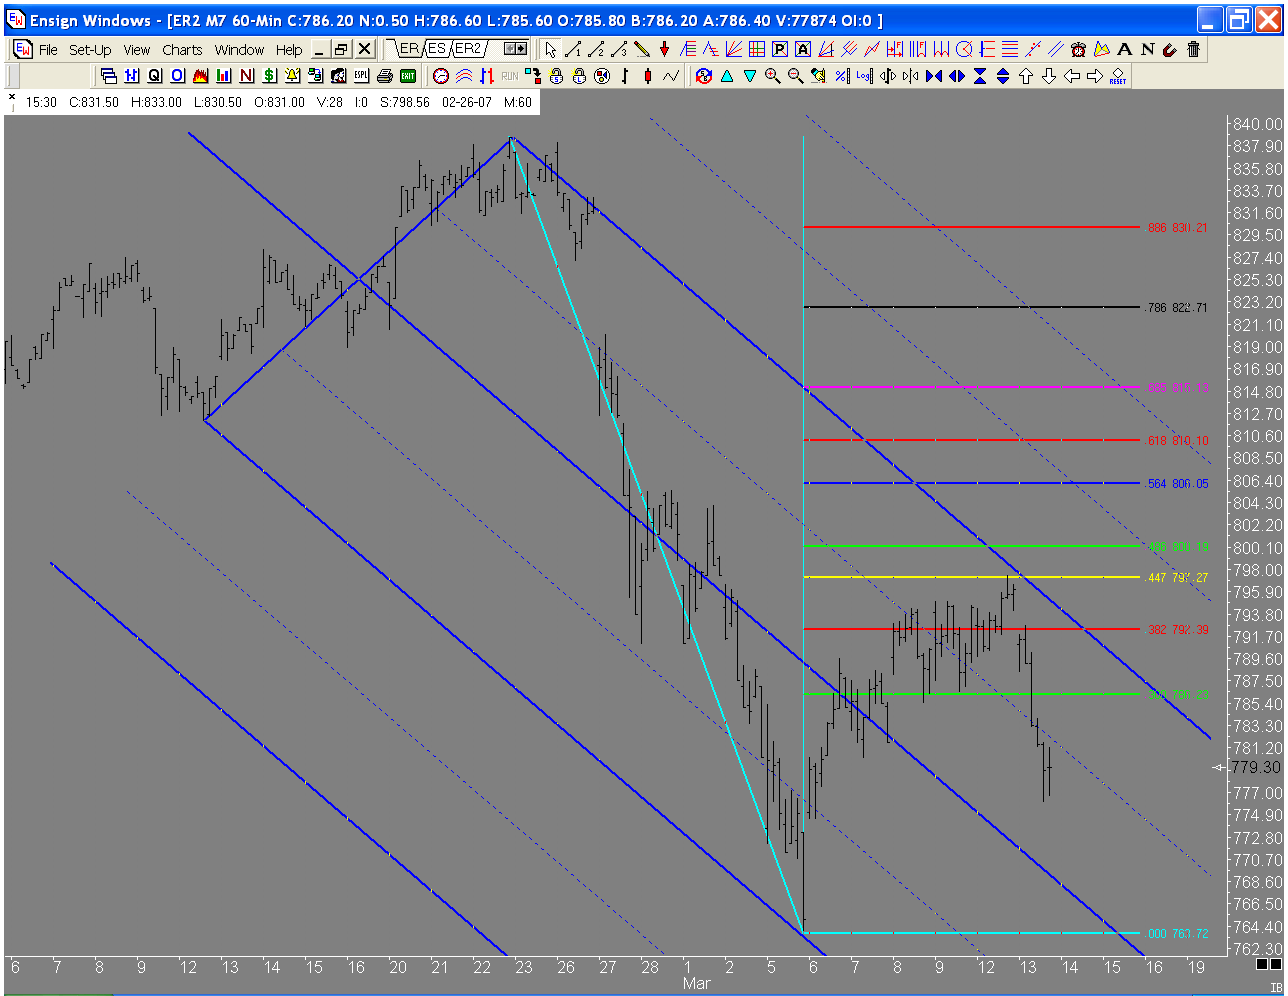
Key 13-min lower // right here. Russell down over 20 from that 797 area high. Although there is the 60-min ML a bit below, this is a key area here, and if it goes, it tells me a lot.
JI
jimkane
Rep: 3,058
Posts: 33,089
Straight up off that, but it rolled dead off a key spot. This is so nice I will post a chart after the close of this roll here. It's amazing.
JI
jimkane
Rep: 3,058
Posts: 33,089
Nice chart, Duane. Post the all-sessions with a tick chart and look at that.
OK, here's my artwork. Step aside Van Gogh, Picasso, all you guys, and look at some real art. It's not art because I drew it, it's art because it exists.

Here's how I adjusted my 13-min set once I could see the lower // of the older set was going to go. If you use the 'old' set you'll see the division and warning lines point to similar things. The two arrows show the area I will zoom in on, so keep in mind this lower //, which I won't show on the 1-min here, to avoid getting it too cluttered.

The first arrow is where I locked this obvious 1-min set. Do the work and you should be able to find this one easy. That's also the lower // area from the 13-min set. The second arrow shows the first rollover point, right off a .564, right down to the ML, which was another .564, at the third arrow. It ramps straight up to the fourth arrow, at the upper //, at the .300 off the high of the day. Just look at these time factors! It drops like a rock, right back to the ML, which is at an .886 and 1.460 overlap, at the fifth arrow, where that 13-min lower // comes back in again. Keep in mind I am only showing a framework here, at best.
Up it goes (check that pullback and see what that shows), up to the first outer upper division line, right in the .786-.886 zone. What does that mean? Yes, the green numbers show the bigger 4-Point Continuation Pattern that came together right there by the sixth arrow. Down it goes to a new LOD, right at the ML again (where's the 1.272?) by the seventh arrow, where it bounces up to a .447, at the upper // by the eighth arrow, where it rolls. It then bounces and hits the upper // again, where it fades off, at the last arrow.
Now, here are my questions:
1) Is this all random?
2) Do I perceive this to give me any kind of edge?
3) Without even hinting at making any claims whatsoever, is it any mystery why some people have told me they have never seen anyone on the right side of the market as much as me?
4) Now, is that art, or what?
5) Isn't it cool to have a forum where everyone has already bought the books, and hence with nothing to sell, 'prove', or try to convince anyone of, I/we can show a chart like this after the fact and it is understood and accepted that it isn't a well-chosen after the fact example designed to show an unusual situation, and convince people to buy the material?
The methodology is what it is, the market is what it is. It either helps you, or it doesn't. If it does, incorporate it, if it doesn't, don't. I know what my viewpoint is.
P.S. The questions are rhetorical, and not meant to actually be answered :-)
Charts courtesy of Dynamic Traders Group - www.DynamicTraders.com
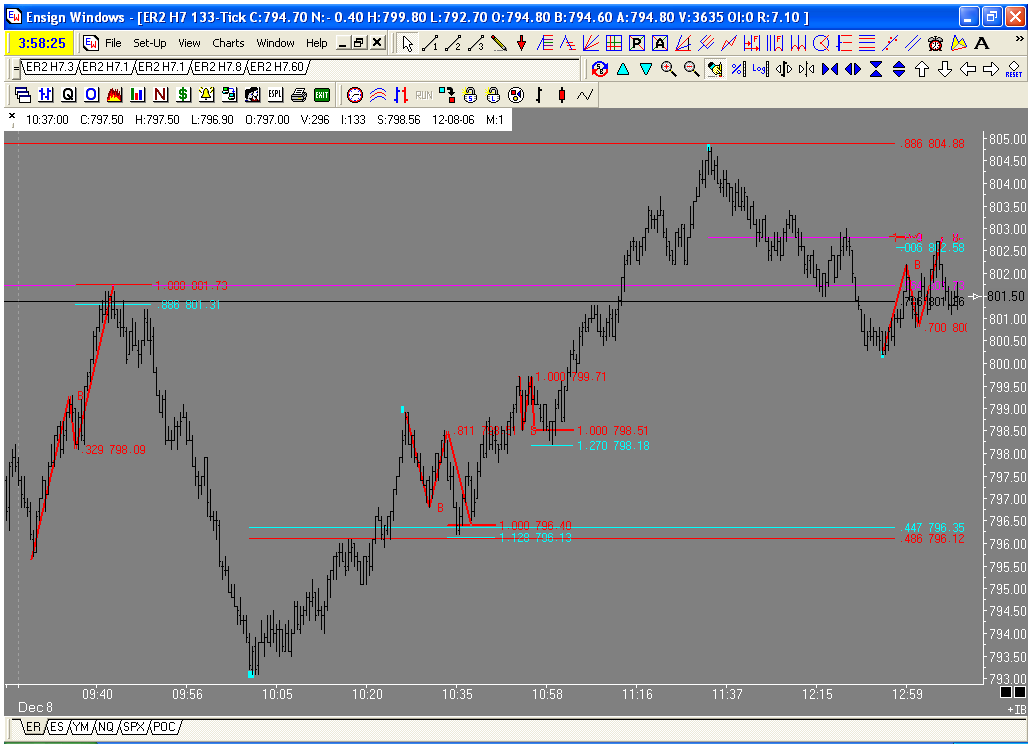
OK, here's my artwork. Step aside Van Gogh, Picasso, all you guys, and look at some real art. It's not art because I drew it, it's art because it exists.

Here's how I adjusted my 13-min set once I could see the lower // of the older set was going to go. If you use the 'old' set you'll see the division and warning lines point to similar things. The two arrows show the area I will zoom in on, so keep in mind this lower //, which I won't show on the 1-min here, to avoid getting it too cluttered.

The first arrow is where I locked this obvious 1-min set. Do the work and you should be able to find this one easy. That's also the lower // area from the 13-min set. The second arrow shows the first rollover point, right off a .564, right down to the ML, which was another .564, at the third arrow. It ramps straight up to the fourth arrow, at the upper //, at the .300 off the high of the day. Just look at these time factors! It drops like a rock, right back to the ML, which is at an .886 and 1.460 overlap, at the fifth arrow, where that 13-min lower // comes back in again. Keep in mind I am only showing a framework here, at best.
Up it goes (check that pullback and see what that shows), up to the first outer upper division line, right in the .786-.886 zone. What does that mean? Yes, the green numbers show the bigger 4-Point Continuation Pattern that came together right there by the sixth arrow. Down it goes to a new LOD, right at the ML again (where's the 1.272?) by the seventh arrow, where it bounces up to a .447, at the upper // by the eighth arrow, where it rolls. It then bounces and hits the upper // again, where it fades off, at the last arrow.
Now, here are my questions:
1) Is this all random?
2) Do I perceive this to give me any kind of edge?
3) Without even hinting at making any claims whatsoever, is it any mystery why some people have told me they have never seen anyone on the right side of the market as much as me?
4) Now, is that art, or what?
5) Isn't it cool to have a forum where everyone has already bought the books, and hence with nothing to sell, 'prove', or try to convince anyone of, I/we can show a chart like this after the fact and it is understood and accepted that it isn't a well-chosen after the fact example designed to show an unusual situation, and convince people to buy the material?
The methodology is what it is, the market is what it is. It either helps you, or it doesn't. If it does, incorporate it, if it doesn't, don't. I know what my viewpoint is.
P.S. The questions are rhetorical, and not meant to actually be answered :-)
Charts courtesy of Dynamic Traders Group - www.DynamicTraders.com
JI
jimkane
Rep: 3,058
Posts: 33,089
Does everyone see that the 797 high was right off that daily ML I discussed? That was the basis, with the 60-min upper // and the .447 off the high, for the area. Dropped over 23 points right off there, with a high of 797.40...
MR
mreiserer
Rep: 110
Posts: 2,220
Well, you nailed it once again. What more can be said?
That last snippet at the end of day on the 1min looks like a 4pt CP as well, doesn't it (maybe point 3 is a bit shallow)?