Hi Jim,
Thanks for opening this Forum to your students and giving us an opportunity to show our charts and share our ideas.
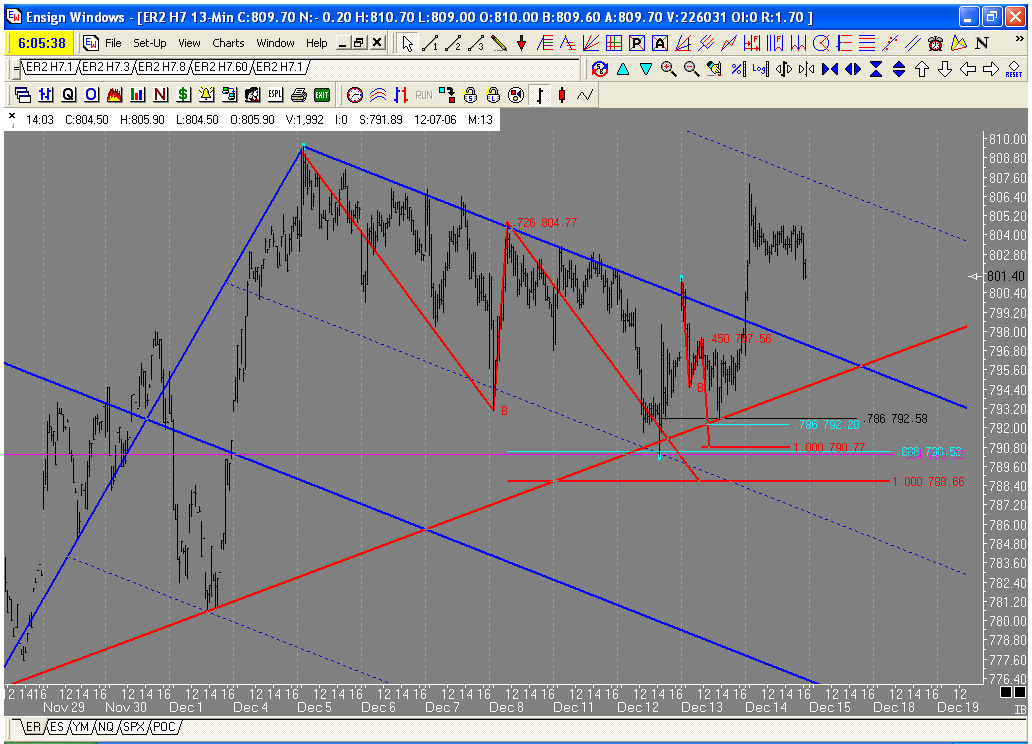
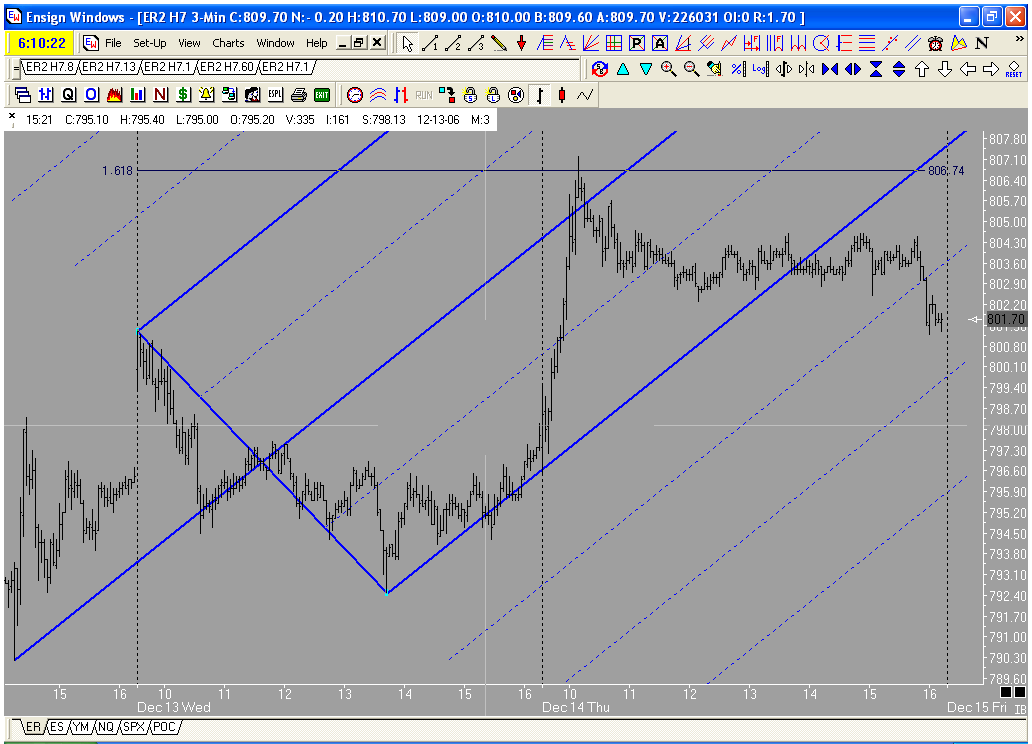
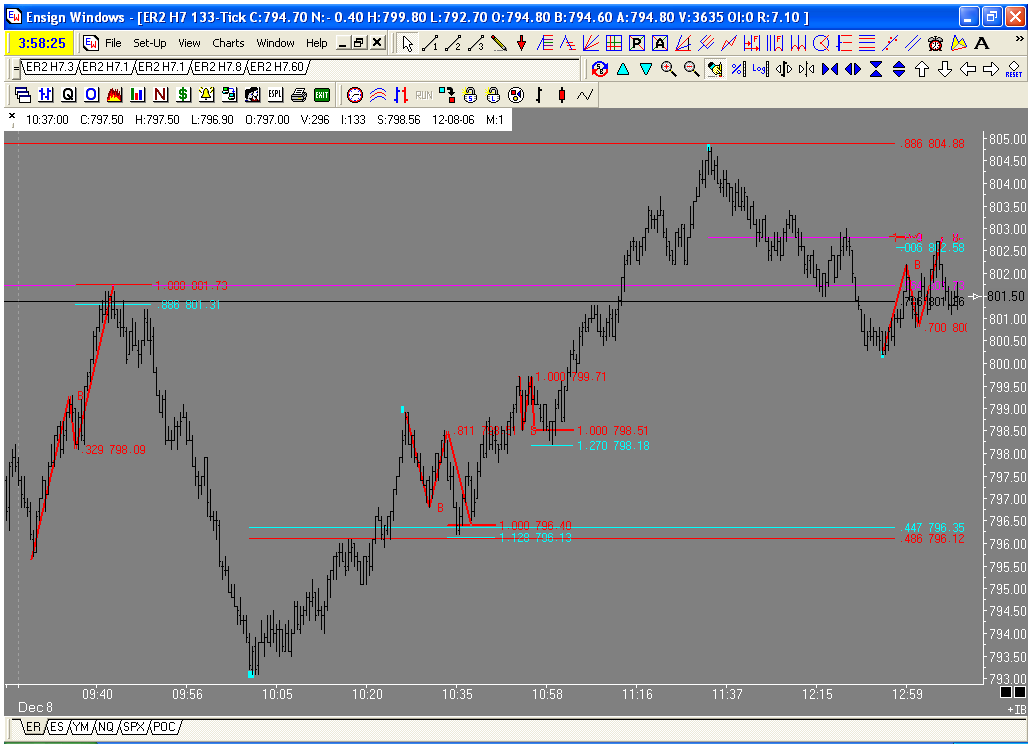
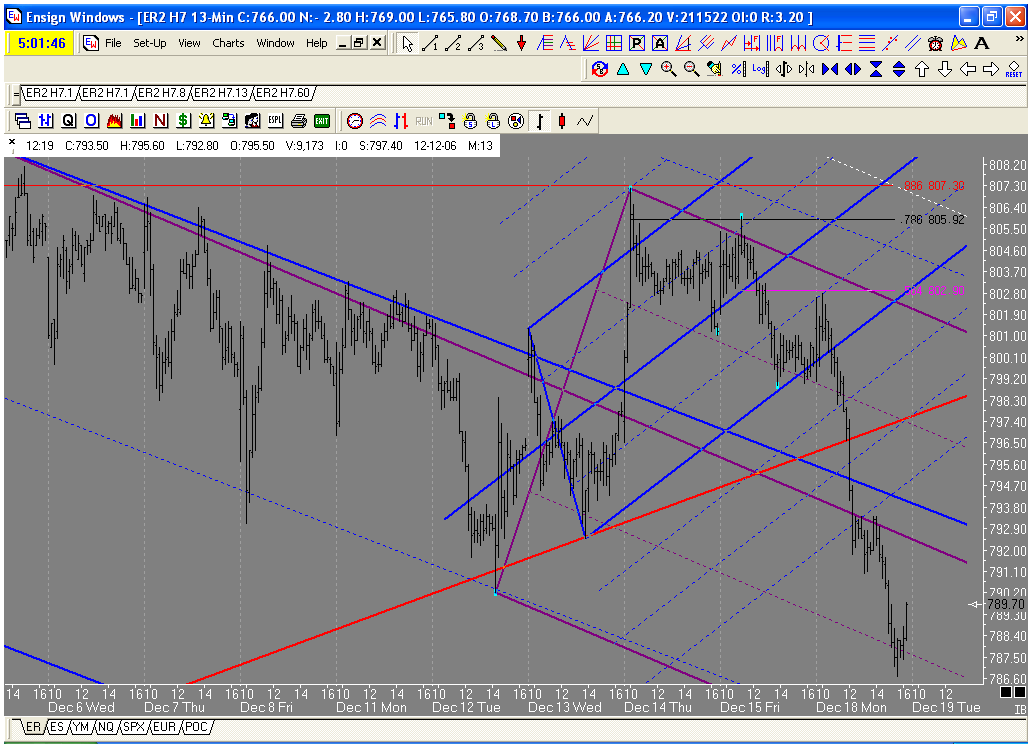
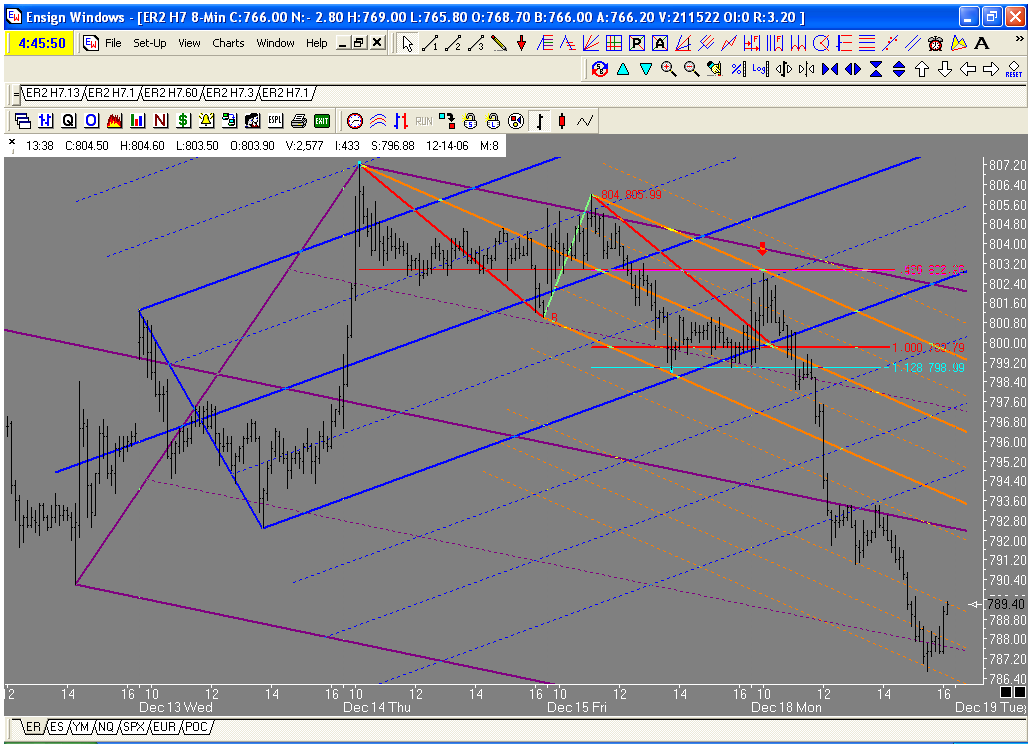
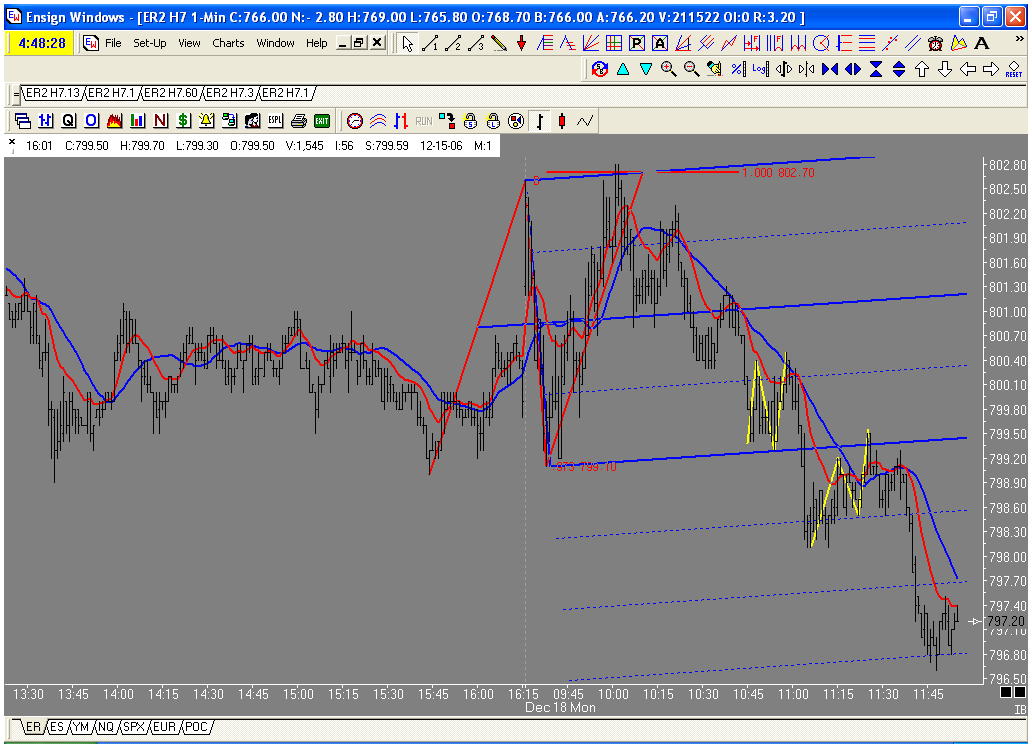
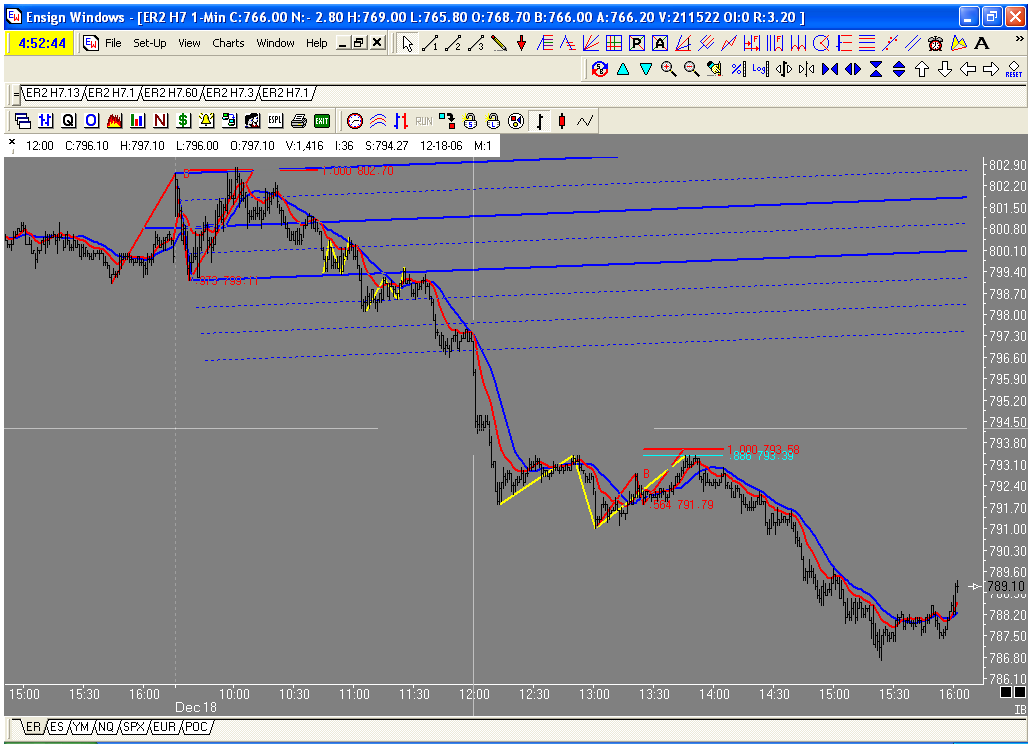
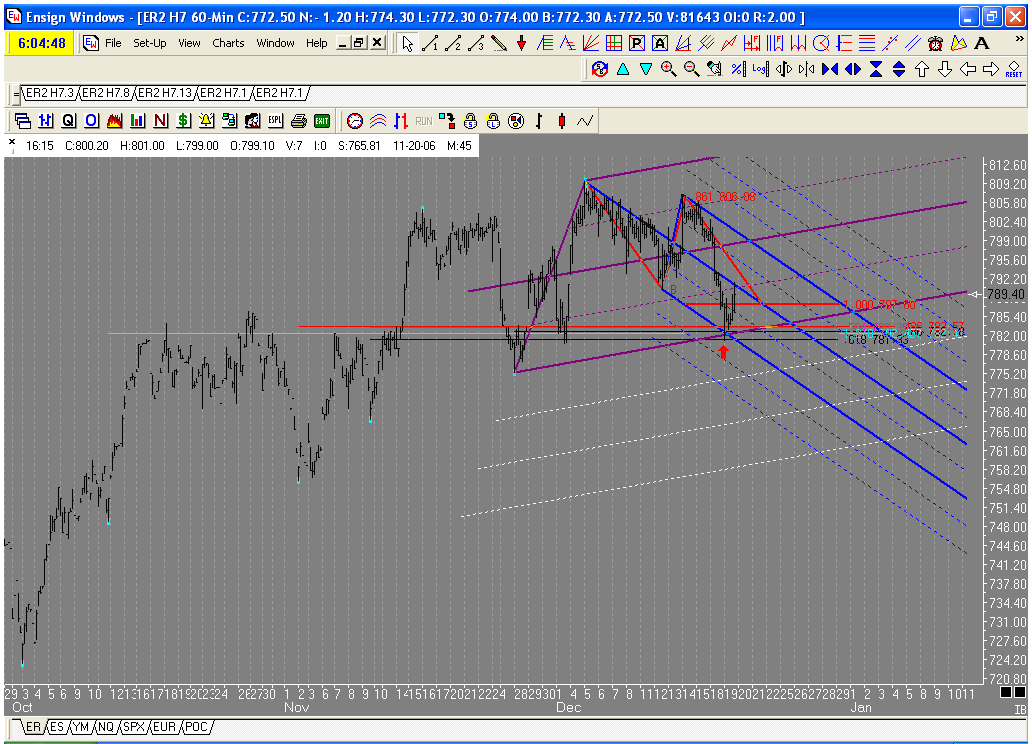
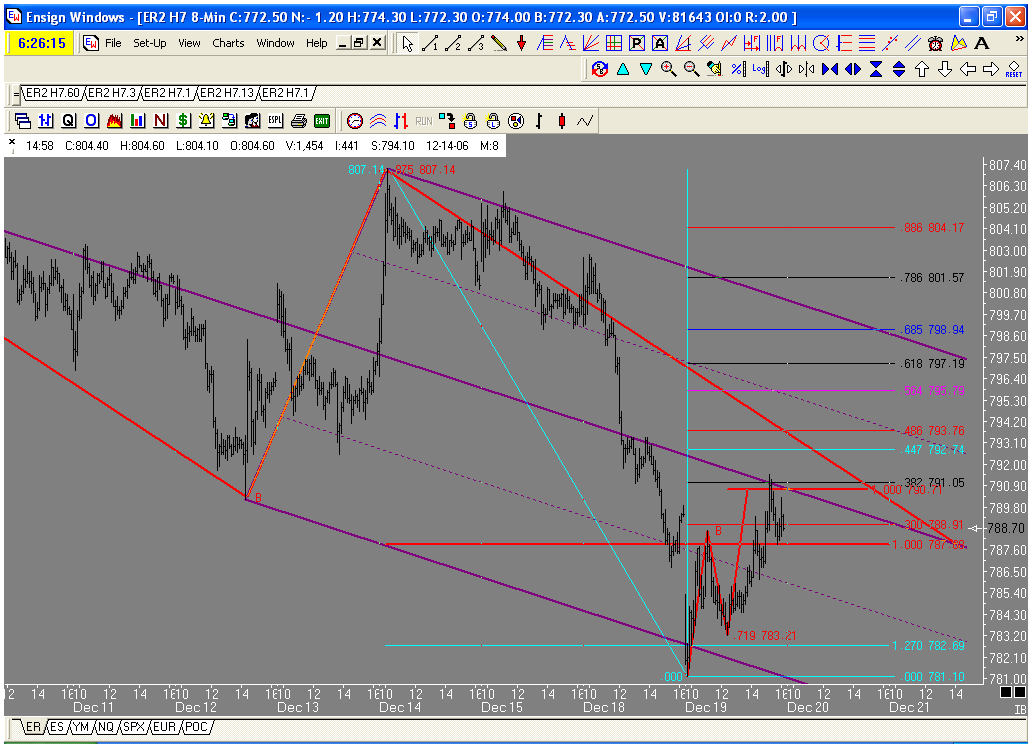
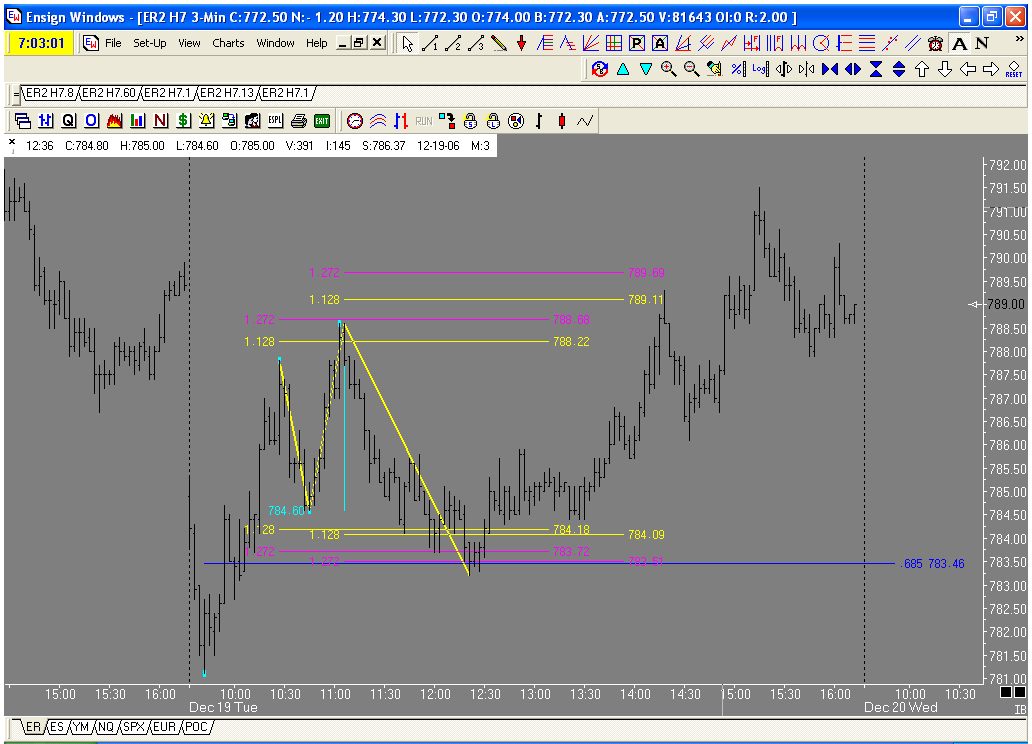
Here is a chart of todays ABCD's in the russell. I will post a context chart later. Today was one of those days where the market changes direction on Jim's unique Fib numbers, Had you been trading with standard fib numbers you may not have noticed these PTA's. Is it me or is .564 becomming more and more prevalent?
TO
TonyC
Rep: 99
Posts: 471
Hi Duane
I've seen U using x-ticks per bar charts for ur entries (im guessing) and I was wondering how do u relate the proportion (ratio) with the x-min/bar charts from the traded and context time frames? . The common entry technique with x-ticks charts I'd use might be swing h/l violations but what about MA's or trendlines ,channels etc? what happen to the geometric balance of price and time ?
Although I can't really explain why it works for me, I often use the regression channels on my single-tick charts combined with swing violations for my scalp trades.Im just curious about what works well from ur experience with these x-ticks charts? as a rarely use that format.
T
DU
Duane
Rep: 100
Posts: 1,095
Hello Tony,
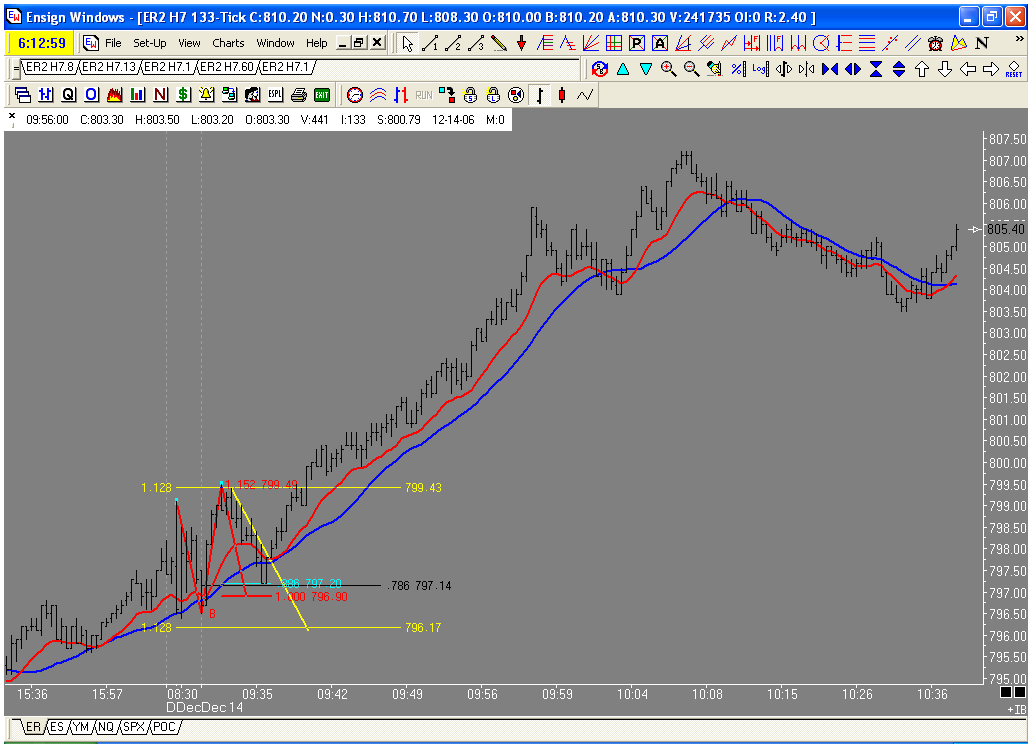
Nice charts by the way. I use the tick charts primarily for the well defined ABCD's that I do not always get with the minute chart. The tick chart is also helpful in defining ABCD's that may have begun to form in ovenite action. I know what you are saying about using these charts in context with other charts, however since each bar depends on the volume the context changes everyday depending on the volume, so I don't really look at them this way. The tick chart often give me a very low risk entry if I do not need much conformation to enter a trade. Today for example, The TD ABCD that started to form overnight was a gift from the trading gods. Jim laid out the premise yesterday, this thing was ready to move. The risk on a trend line break was .60 and the risk on a close was above the MA was .80. I use the tick chart to help me find these low risk trades.
Nice call Jim, today was a wave 3! The TD ABCD is one of my favorite setups. Four new ABCD's is destine to be a trading classic. So much practical trading information in this book.
TO
TonyC
Rep: 99
Posts: 471
Thanks Duane,
Very interesting points. I can see how the tick chart can be useful for the overnite outlook . Trading the small ABCDs after a reaction move off of a PTA is a good approach as well and I trade that way quite often too. The use of the multiple ticks per bar(144tick,89tick etc) charts to make the patterns more visible on the very short term setups has merit IMO. I'll investigate more on that idea and see if it can help my own battle plan.Liquidity is key here,for setup reliability, I think.
T
DU
Duane
Rep: 100
Posts: 1,095
Hello all,
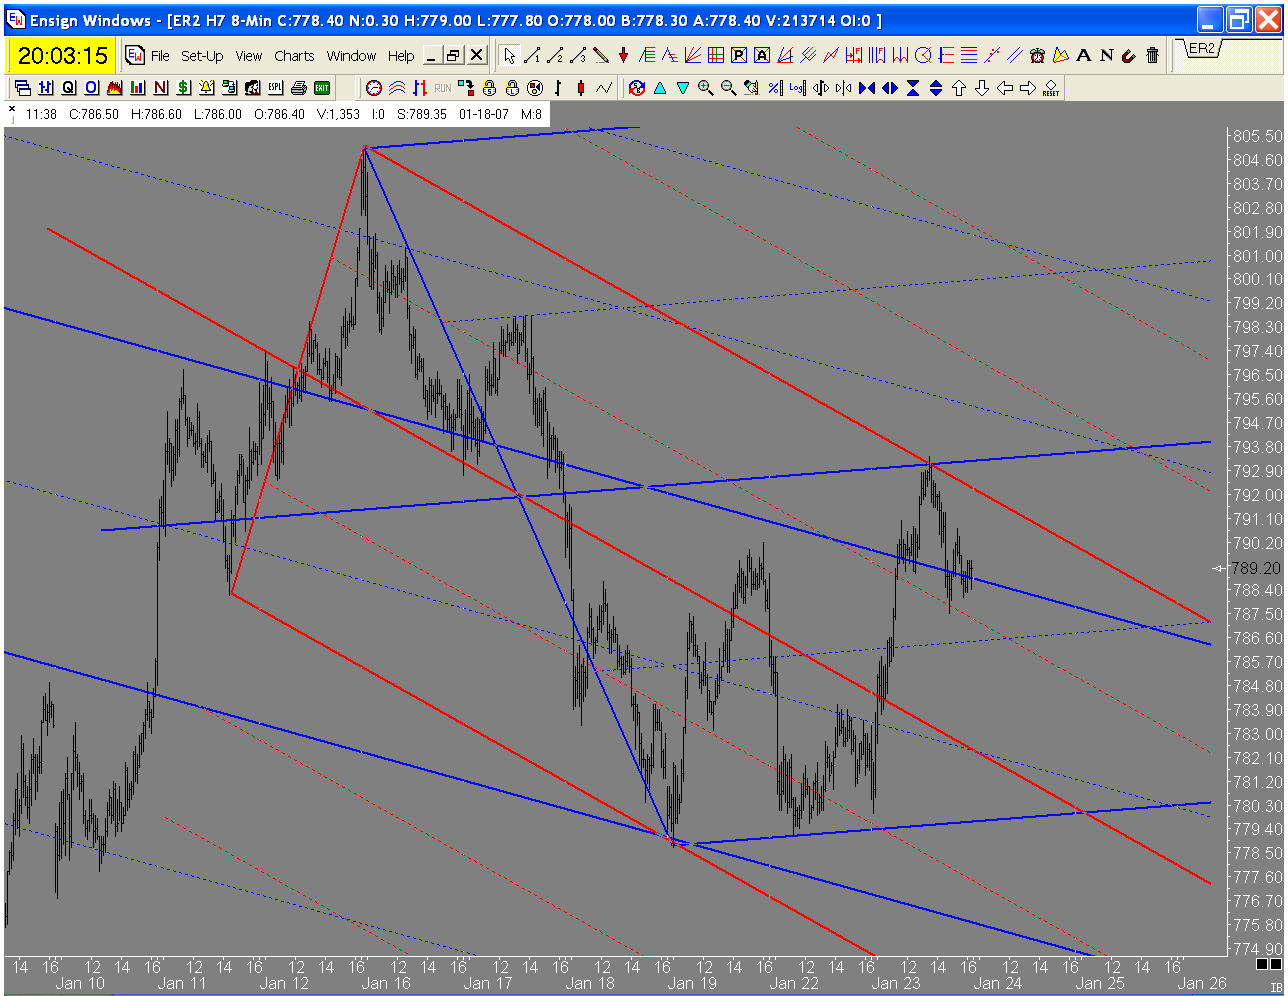
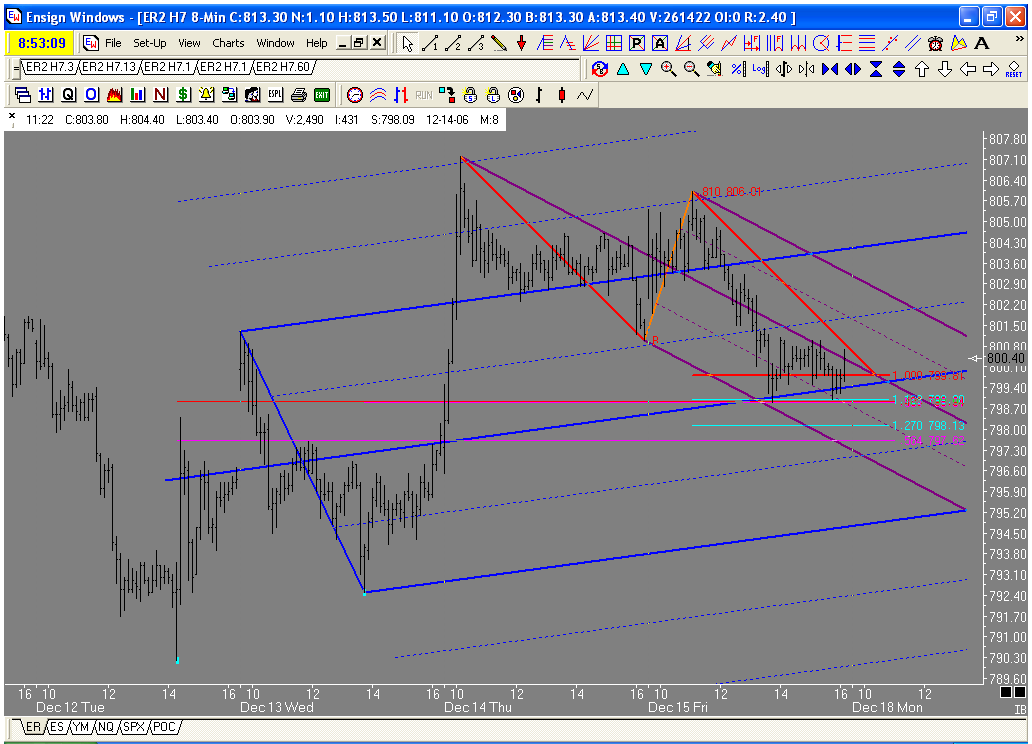
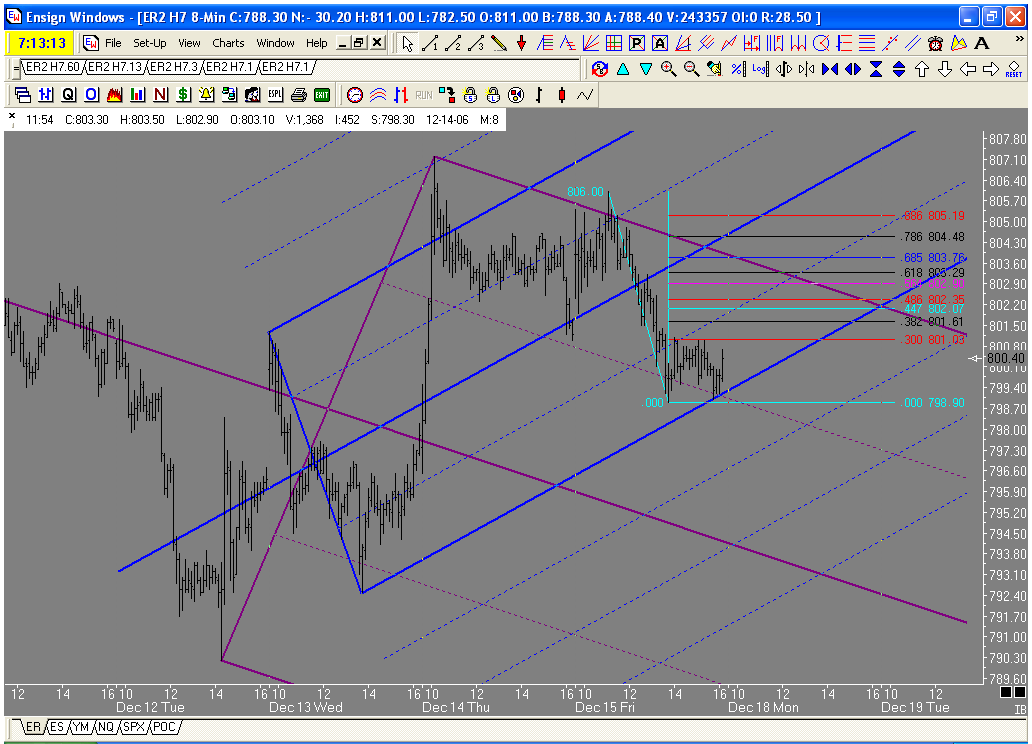
I hope everyone had a good day trading today. Jim gave us many clues for today. I think that his free commentary is better than most pay services. To quote Jim "As I close, I'll mention that this week's chart of the week is for you mini traders. I laid it out like I did for a reason. Do the rest of the line work and see if you can figure out what I am watching, and why. What clues are present on the chart right now with regard to that ABCD? This one should be a good educational example. " From what he said, I was thinking about an ABCD that rolls over. He has given us this example in in the crude oil market earlier in the year, here are his comments fron the commentary archives " Crude rolls below the trendline, approximated as best as I could with the red line. It then does exactly what I don't want it to do if this is going to respect the long setup. It forms an ABCD that comes up to 'test' the line from below, not once, but twice. It does not have to touch the line for it to be a 'test'. I added a 'standard' median line set and a modified Schiff median line set onto the pattern. Do the work here and put a set or two on the higher timeframe price action (especially using tick charts). Take a look at what else hits right here. Notice, too, the time symmetry.
At this point all is not lost from the perspective of a long setup. This is what I mean by price action and behavior, and reading the price action. What I want to see is a 'blow-out' of this area right here. That would tell me 'wave 3' and not a CD leg and down it goes. A roll here is to be expected, it's just that I want to see it get picked up at a 'trend continuation' retracement area (see that line intersection area below?). If that doesn't happen, my commitment to the long side will wane, and I may 'flip' to the short side"
Th ER formed an ABCD at the .564 ret, the schiff upper // just as it did in the crude example. From PTA's to trailing stops, the tools that Jim have given us to work with are amazing!.
JI
jimkane
Rep: 3,058
Posts: 33,089
Duane,
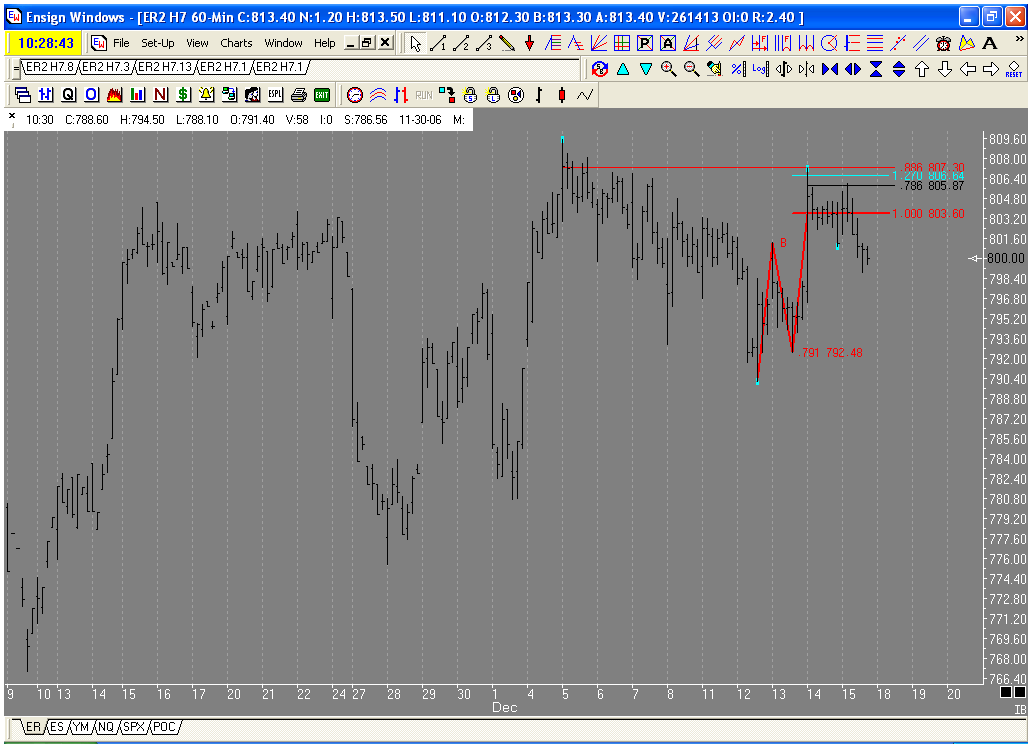
Great job! You nailed just about every nuance and concept I was trying to get across. I received an e-mail last night from a mentor student and I discussed the very scenario you laid out. Lo and behold it did it, as I suspected it might. Notice, too, the 'double bottom' ABCD with 'retest' viewpoint for the setup trigger. Your nicely labeled ABCD could also be seen as a 'retest' of a DB ABCD that had as its CD leg the AB leg of your ABCD. Regardless of the viewpoint, it was golden. I wonder how many free commentary readers got this in the detail you did? Well, what you just posted here was my plan for next week's commentary. Do you want to write it for me? What a day.
Jim
P.S. Do you see the bigger pattern here?