quote:
Originally posted by mreiserer
That is just beautiful stuff.
Even though I'm almost totally left brain by nature (as I mentioned in one of the commentary or books, I forgot where, I once scored a +30 on a right brain/left brain test where -30 was full right brain and +30 was full left brain, with zero being neutral), I have worked hard to allow my right brain to participate, and develop the synergy (again with that concept) between the two halves, between the yin and yang. I have come a long way, I feel, in this process, and it is now a big part of how I can holistically see the overall picture. I'd hate to not be able to use both halves.
This gets on to my hints at the end of
Median Line and Fibonacci Synergy, where I mentioned market rhythm and market flow, and Bruce Lee's concept of 'broken rhythm'. I am progressing nicely on my own higher quest, and the right brain is a big part of this. I suggest everyone try to dig up some words from Ed Seykota, and his thoughts about markets and ocean waves. I'm nowhere near 'releasing' any of this yet, and even if I did nail it down more, it may be beyond explanation with words, I'm not sure yet.
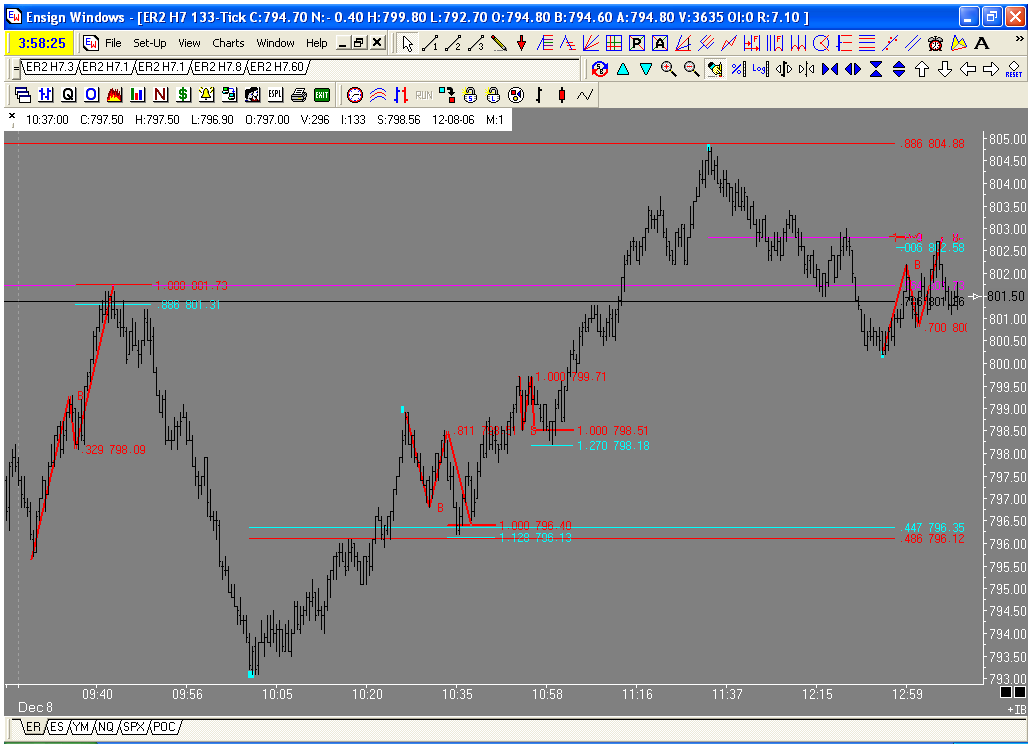
So, what is the point here? If you know me well, you know I don't ramble (OK, maybe sometimes...), and if I am yapping away, I have a very specific point I am trying to convey without saying it out loud, so the student can learn by 'guided discovery'. And that point here? And why did I choose to reply with quote to M's post? It's beautiful alright, and beautiful in an artistic sense. And I feel that is because at the higher levels it becomes a blend of art and science, yin and yang, left and right brain, and so on.
If I hadn't shown all of you so much technical material first you would be right to say this sounds like a lot of jibberish, a lot of metaphysical mumbo jumbo. But once you get the technical fundamentals down, my opinion is that there is a lot left awaiting you on the artistic side. This, from a mathematician who can literally only draw stick figures. I have frequently said this or that chart is a piece of artwork, and now I have found a way to create magnificent art when previously I could only draw a poor stick figure.
I'll leave with this thought. Has anyone seen the movie A Beautiful Mind? In one scene he looks at the board and all the code, and he starts to see the pieces come off the board and move into all these patterns, as he decodes this in his mind. He sees what is there, and how it all fits into this organized layout. Well, as I advance my craft and my work I am starting to see the fractal nature of this, where there are setups on various timeframes, and they are all interconnected and linked, as we all know from our work in here, but I am seeing it now like he saw the board in the movie. I don't see it as much as a heirarchy of layers as I see it as all folding back upon itself, all really a part of the same thing. I can't explain it any better than that.
It's like how you start walking on the surface of the earth and if you walk long enough you get back to where you started from. Imagine trying to explain that someone who can't conceptualize a sphere. I can't explain any better right now, but I am just saying the hint I put at the end of
MLFS, well, I am making progress on that, and the beauty and art of this is attracting me more than the science at this point. There really is something going on with this work, in my opinion, and I hope someday to be able to show it. Hmmm, turn a mad, mathematical genius (I'm just funning...) loose on the market and you never know what he might come up with :-)
Alright, so I ramble a
little sometimes...