MyPivots
Sign In
DU
Duane
Rep: 100
Posts: 1,095
Hi Jim,

Thanks for opening this Forum to your students and giving us an opportunity to show our charts and share our ideas.

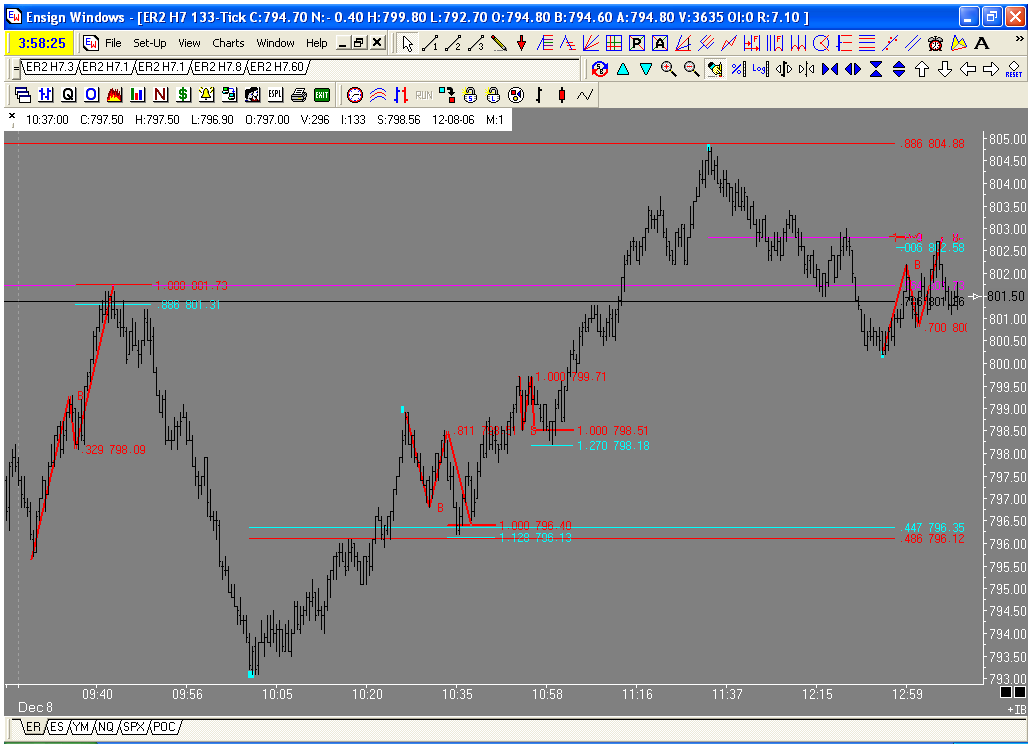
Here is a chart of todays ABCD's in the russell. I will post a context chart later. Today was one of those days where the market changes direction on Jim's unique Fib numbers, Had you been trading with standard fib numbers you may not have noticed these PTA's. Is it me or is .564 becomming more and more prevalent?

Click image for original size
No Description Entered
DU
Duane
Rep: 100
Posts: 1,095
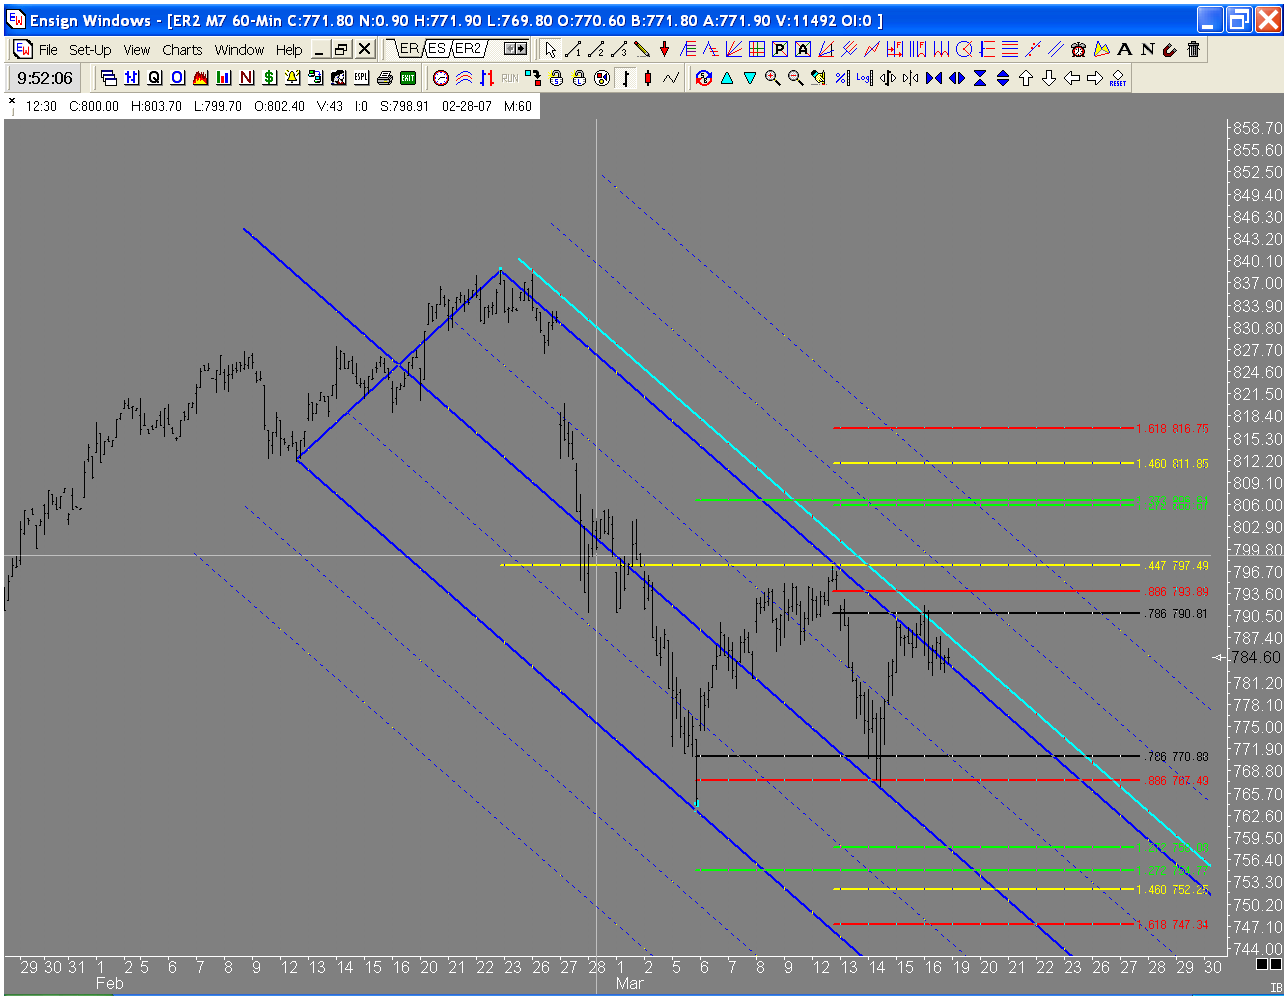
It is snowing here in Jersey. As you can tell I have alot of time on my hands as I am waiting for the snow removal company (my son) to complete his work. I am looking at this chart and wondering who will win this battle. On one hand we have the almighty .886 for the bullish case, on the other we have the powerful 4PCP for the bearish case (my personal choice). What clues should we be looking for Jim? Anyone else?


Click image for original size
No Description Entered


JI
jimkane
Rep: 3,058
Posts: 33,089
What would be an average first thrust for the 4-Point? Did it make it there yet? If not, could we be in a 'wave 2' of the first thrust? If so, what possible ABCD style patterns could be shaping up here? Or could all this be a EXP ABCD, perhaps as a 'wave 4' and then the 4-Point really completes a bit higher, or the EXP even used to get it to the bigger ABCD's we were looking at above? The flow of the 60-min upper// and sliding // should be respected if that recent high was the reversal point for the 4-Point. I will mention that there is another, unreleased ABCD variation that completed right in here, and I'm watching that, too. So all these factors, and some others, give me things to watch as I lay out scenarios and assess probabilites as new price data comes in.
JI
jimkane
Rep: 3,058
Posts: 33,089
quote:
Originally posted by roofer

i am confused.as far as i know, i am the only target trader here. i know exactly to the penny why i was bailing out of my short at qqqq 4210 and looking to reverse based on work i have already shown here..and if needs be i will show it here in detail... could someone show me the exit on short and entry on long in the ER and if and how you knew in advance to take trade? i thought everyone else was exiting basis trailing stops and buying on first abcd pullback to line.


OK, Geo, you're on deck. I said I'd get back to this, and I have. I wrote today's commentary to address this, as best as I could. It took me almost seven hours to do it (seems like it should take an hour?). I don't have a lot of long commentaries left in me, I may be taking some time off from that for awhile, I'm not sure. Anyway, I hope this gives you some idea of how I look at things, and maybe we aren't so far apart in what we are doing. And after all that work, I feel like I barely got to any detail at all. But, that's the best I can do with the medium, and I thought everyone would like to see it.
JI
jimkane
Rep: 3,058
Posts: 33,089
Also, I never wait for the first ABCD pullback, I take any reasonable trigger I get right off an area. If I have 'context' for more of a move, and I'm not in, I take an ABCD if it comes up (or as an add-on spot), for example there might be three ABCD's in a row on the 3-minute, and I may play each one for the average expected move (then tighten up the trailing stops), in the 'context' of say a 13-min or 60-min move. Why not just ride through them? Only if I am willing to hold overnight and/or the size of the move justifies taking the necessary heat. The amount of heat I'll ride through i.e. the size of the correction, has to do with the 'traded timeframe', based on what's 'normal' for that timeframe, as far as corrections.
MR
mreiserer
Rep: 110
Posts: 2,220
Great commentary! Thanks Jim.
BB
BBJ
Rep: 100
Posts: 129
quote:
Originally posted by jimkane

quote:
Originally posted by roofer

i am confused.as far as i know, i am the only target trader here. i know exactly to the penny why i was bailing out of my short at qqqq 4210 and looking to reverse based on work i have already shown here..and if needs be i will show it here in detail... could someone show me the exit on short and entry on long in the ER and if and how you knew in advance to take trade? i thought everyone else was exiting basis trailing stops and buying on first abcd pullback to line.


OK, Geo, you're on deck. I said I'd get back to this, and I have. I wrote today's commentary to address this, as best as I could. It took me almost seven hours to do it (seems like it should take an hour?). I don't have a lot of long commentaries left in me, I may be taking some time off from that for awhile, I'm not sure. Anyway, I hope this gives you some idea of how I look at things, and maybe we aren't so far apart in what we are doing. And after all that work, I feel like I barely got to any detail at all. But, that's the best I can do with the medium, and I thought everyone would like to see it.



Jim,

Excellent commentary as usual.
Have you thought about using video as a medium for the commentary / teaching ?
This would allow you to go into more detail IF you wanted to and maybe take less time.

RO
roofer
Rep: 3,689
Posts: 3,574
chart.i always try to have a bullish and bearish case... this is my most bearish case for iwm.in elliot terms, a b-wave triangle before c-wave down to complete correction.


Click image for original size
No Description Entered
MA
Mats
Rep: 100
Posts: 262
Thanks for this nice chart Geo! Now I have some food for my afternoon chartwork. And thanks for all the effort you spent on posting!

Mats
JI
jimkane
Rep: 3,058
Posts: 33,089
Geo,

Your b wave triangle is the 4-Point we have been discussing in the previous posts, that triggered on Friday and gave a nice initial move. Now we see if we get follow through, or if it shoots for the ABCD areas just above. If so, then I'd watch if the ABCD's roll it down, or if it is actually a 'wave 3'. My preference for trading would be the 4-Point plays out (we don't always get what we want), and what we are in now is a 'wave 2', probably a 'wave 2' of 'wave 1'. I almost always put little marks around my Elliott counts to imply I use Elliott not in a strict sense, but in a 'guideline' sense. The daily, and weekly charts, as posted in my last two commentary, give me ideas if this does play out. It just doesn't seem ready to go down yet, though...
MR
mreiserer
Rep: 110
Posts: 2,220
quote:
Originally posted by jimkane

Geo,

It just doesn't seem ready to go down yet, though...


One thing that sticks out to me is that the 4pt CP seems really big, almost disproportional. By looking at the cash Index on the daily chart it kinda looks a bit like a double bottom ABCD forming that may indicate for price to go higher (to the median line area) to complete a Wave 2. All just possibilities....
RO
roofer
Rep: 3,689
Posts: 3,574
thankyou duane i knew it was back there somewhere...