Hi Jim,
Thanks for opening this Forum to your students and giving us an opportunity to show our charts and share our ideas.
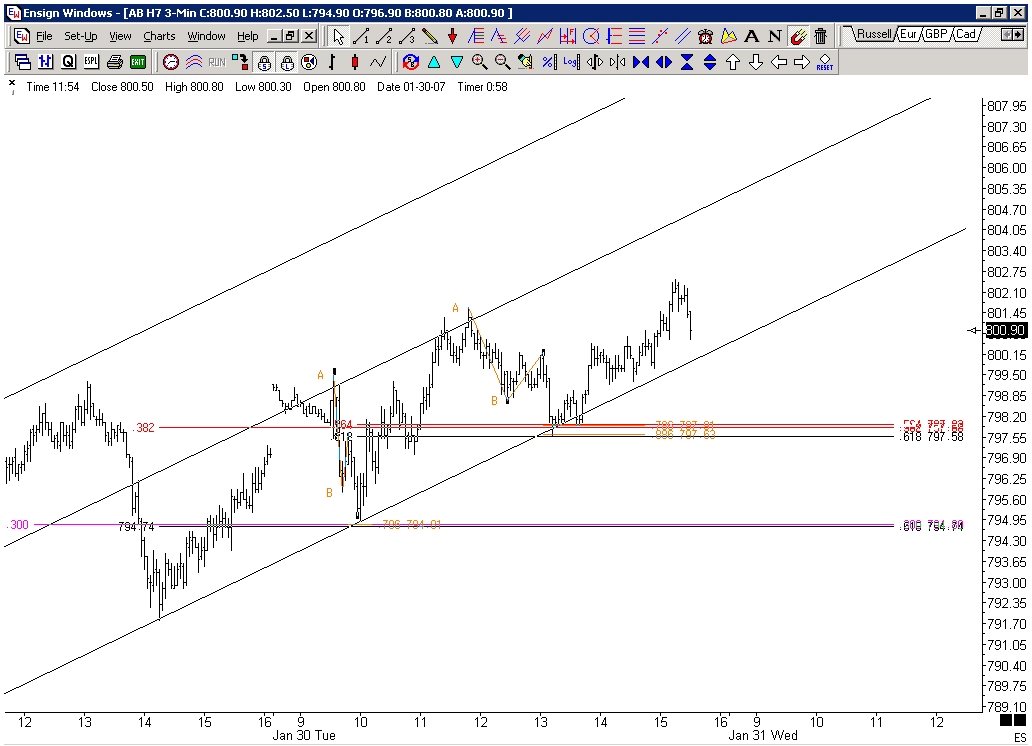
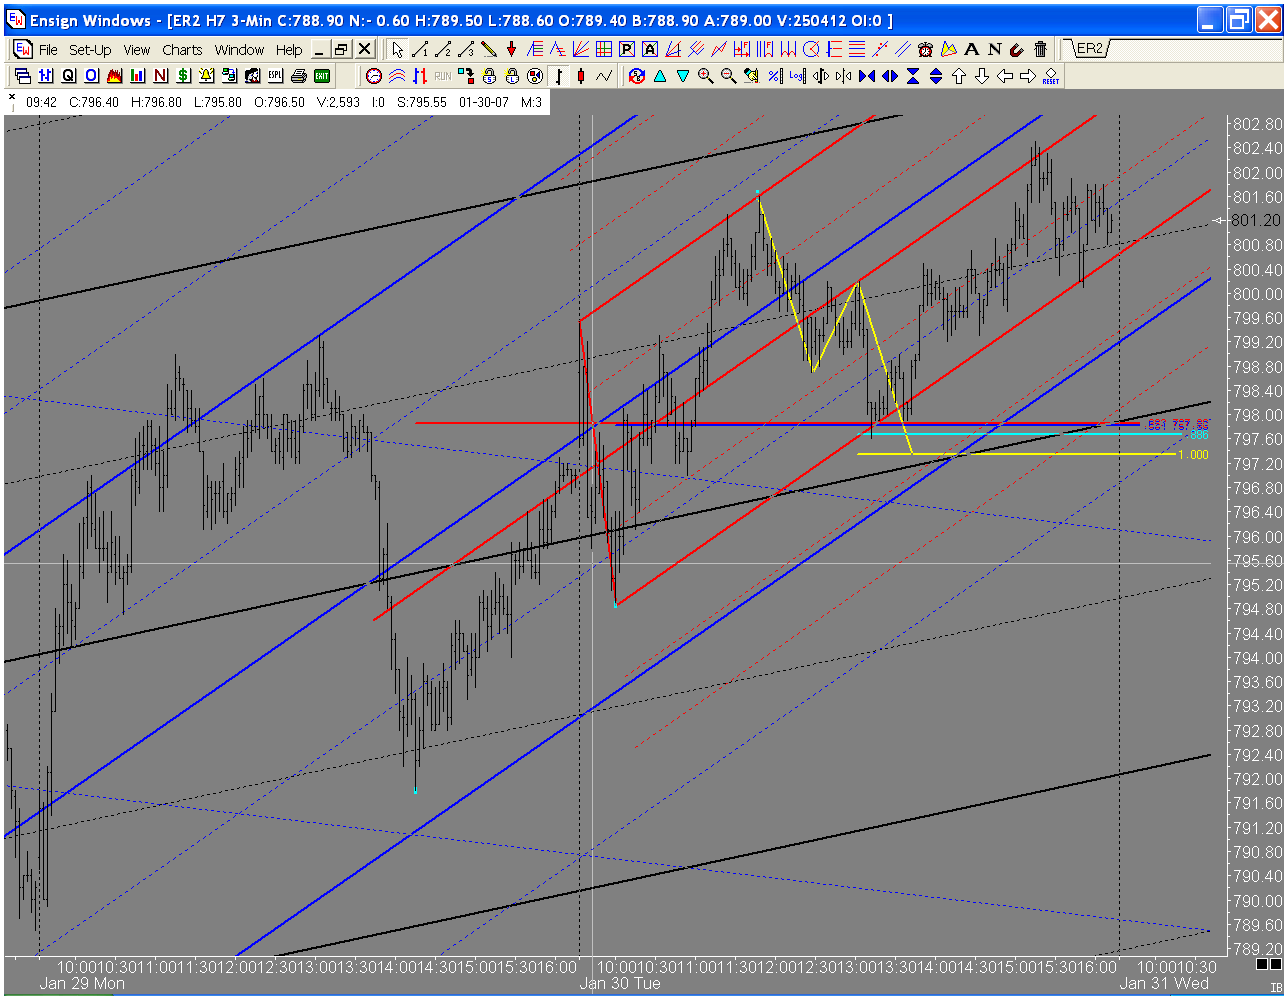
Here is a chart of todays ABCD's in the russell. I will post a context chart later. Today was one of those days where the market changes direction on Jim's unique Fib numbers, Had you been trading with standard fib numbers you may not have noticed these PTA's. Is it me or is .564 becomming more and more prevalent?
JI
jimkane
Rep: 3,058
Posts: 33,089
M,
I'm sure it would be helpful to everyone to know how you 'locked' your set, and how you decided on that, and if you made any adjustments. A chart going back showing this would be great.
JI
jimkane
Rep: 3,058
Posts: 33,089
Also, I see you have one hour of pre-market data on there. You might look to change your settings and get rid of that, unless you have some reason why you are doing that?
MR
mreiserer
Rep: 110
Posts: 2,220
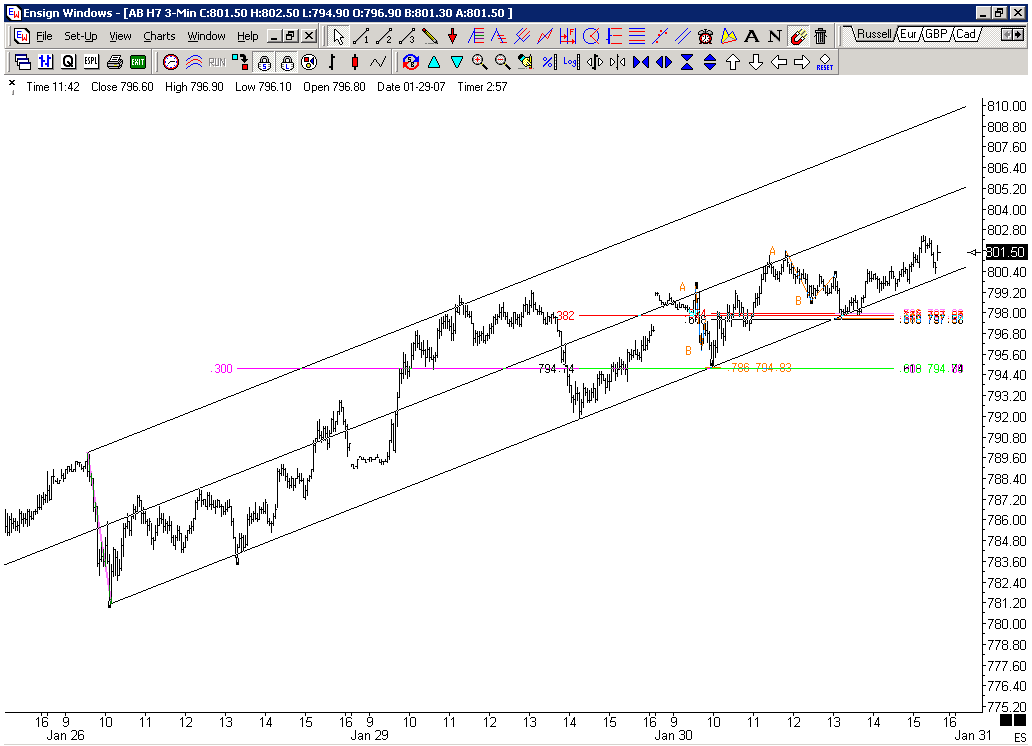
Here it is. The A point is out in "space".
The power of adjusted sets! Kudos to Geo and Jim.
When I create adjusted sets I try every possible anchor point and see what fits based on past price. I don't like working with sets that haven't been 'tested'.This set is as good as it gets, because you could use several anchor points either on the upper // or the lower // and it would still give you the same picture. It's like a perfect trend channel. This is set is locked where price touches the lower // for the 2nd time.
Since it is struggling to make it back up to the median line will we we see a breakout to the downside? Wondering....
MR
mreiserer
Rep: 110
Posts: 2,220
quote:
Originally posted by jimkane
Also, I see you have one hour of pre-market data on there. You might look to change your settings and get rid of that, unless you have some reason why you are doing that?
Yes you are right about the one hour pre-market. I am used to trading 24 hour markets, so this is kind of all new to me. Thanks for the advice.
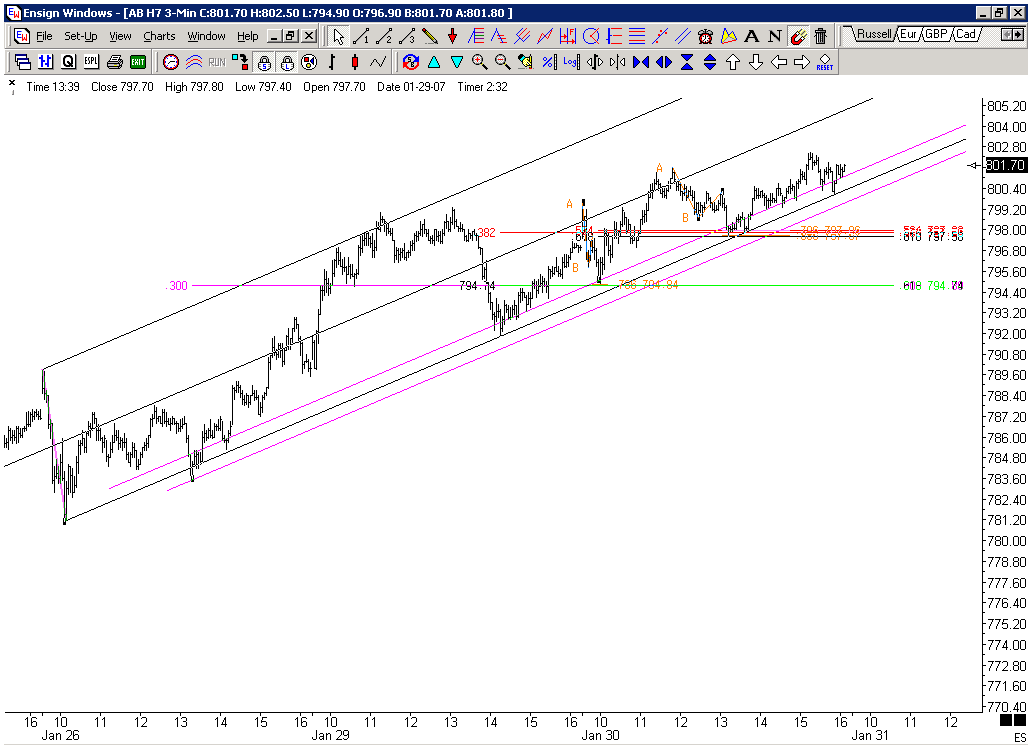
The curious thing is that when I take out the 1 hour pre-market the set still works out nicely, but the lower // wouldn't have come together as nicely with the first ABCD on the chart. It would have required a sliding // based on the first low after the C point. Call it "idiot's luck", heh heh.
See below.
MR
mreiserer
Rep: 110
Posts: 2,220
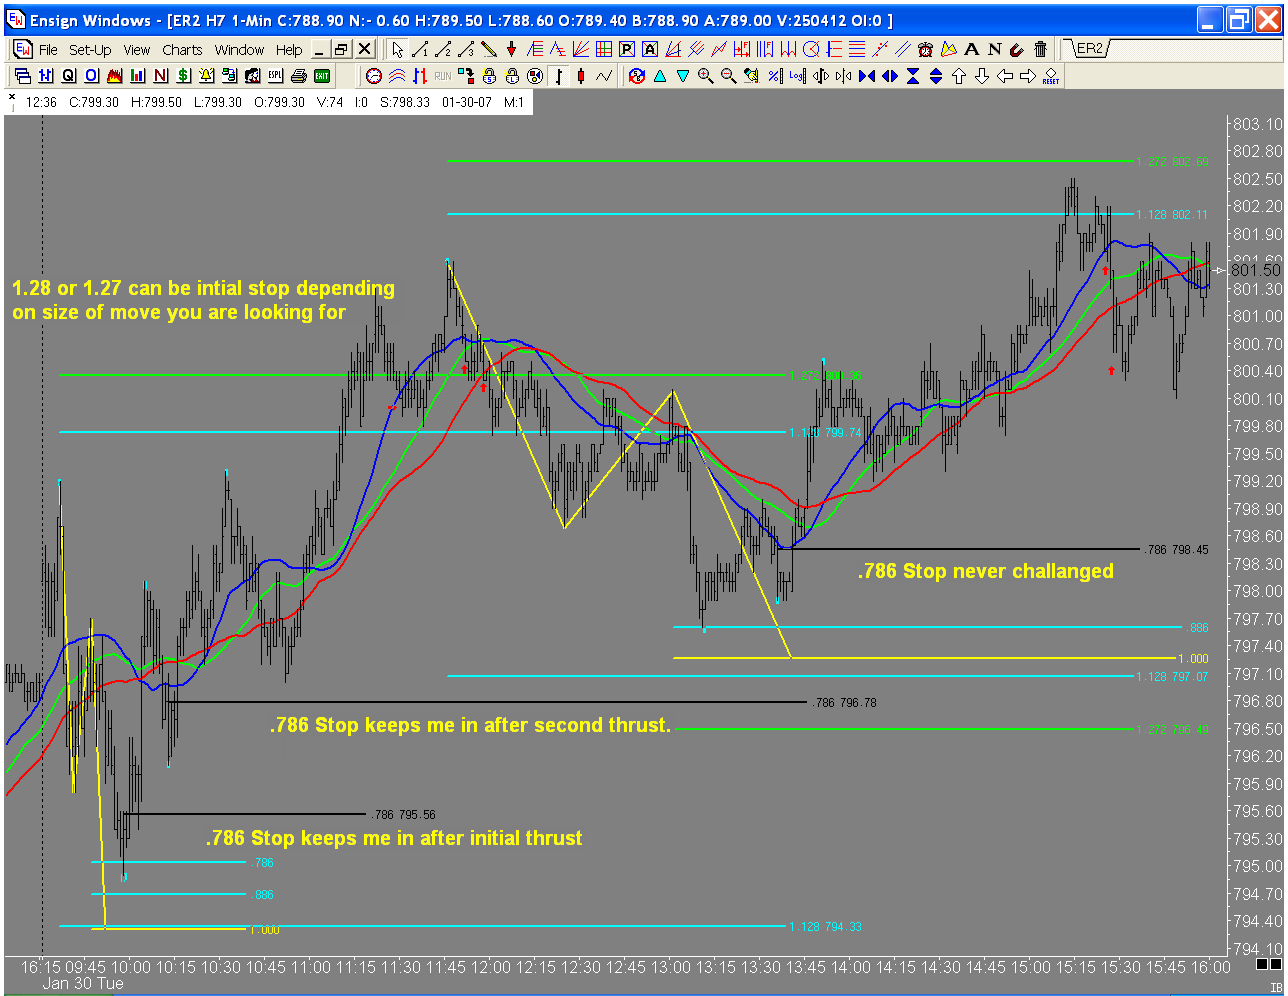
Nice one. I use the .786 the same way. It's my favorite way of moving stops up after initial thrusts (thanks Jim).
Out of curiosity where was your initial stop on these trades?
DU
Duane
Rep: 100
Posts: 1,095
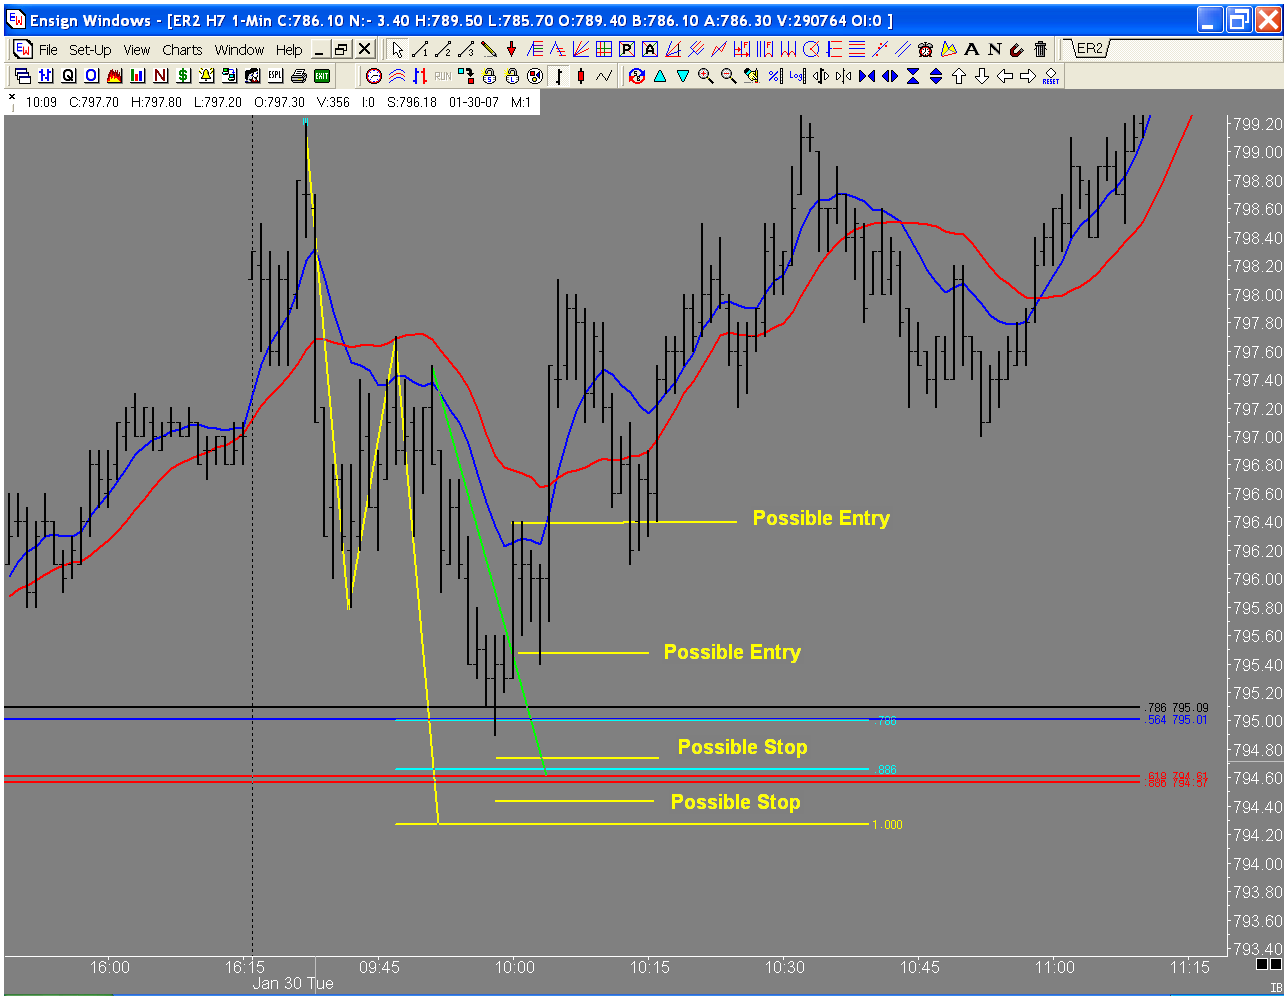
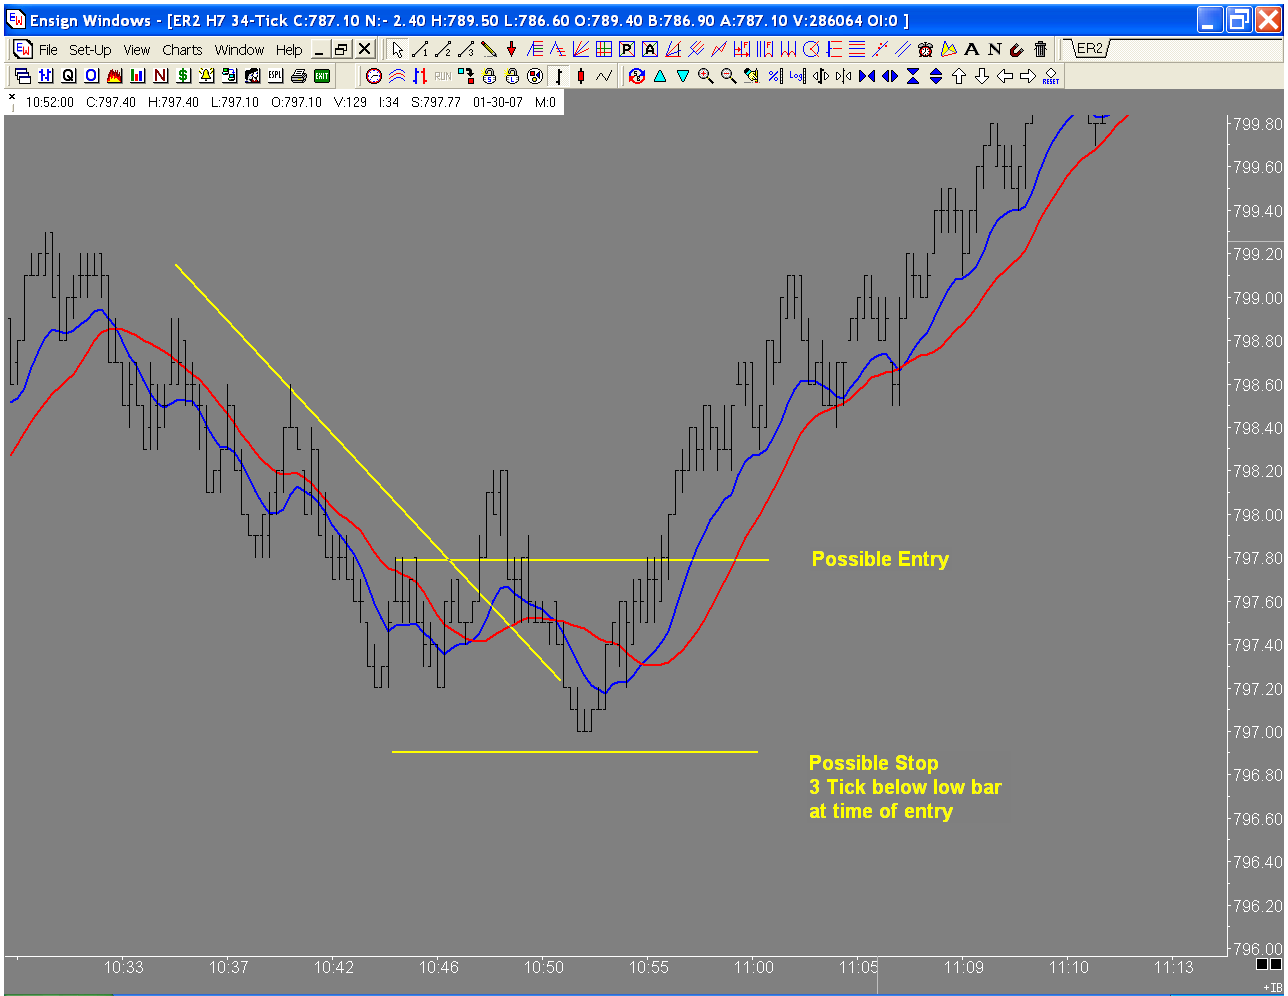
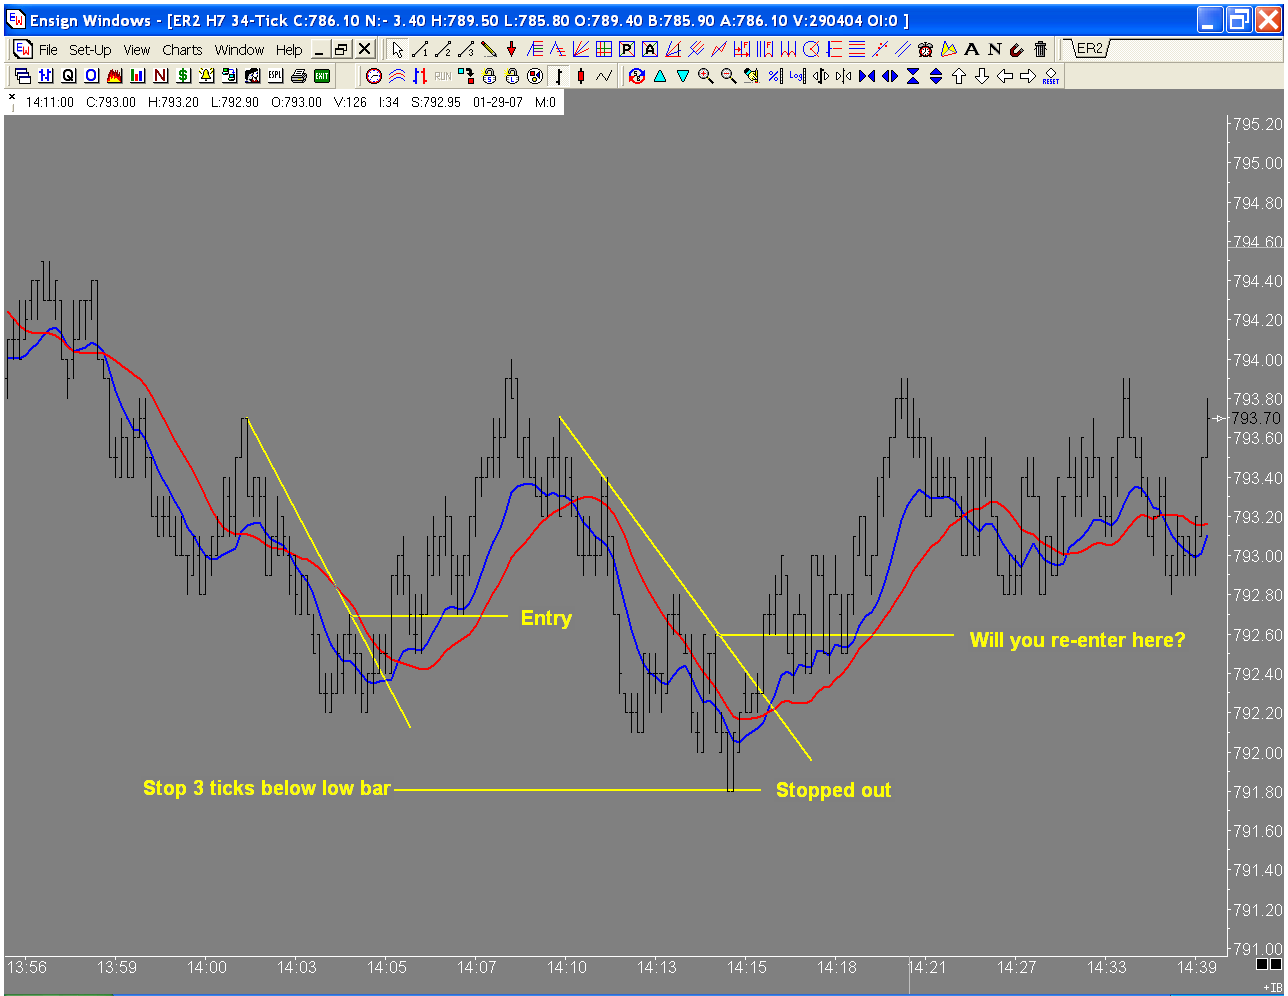
Hi Michael. My stop is usually 3 ticks below the swing low after entry. Once the trade enters the PTA, I use the Pattern entry Technique and dial down to a smaller timeframe to enter the trade, and keep my risk small. The entry is usually at a fib cluster, median line, and or at the completion of a pattern. I will take the trade and if I get stopped out I will re-enter at the next fib cluster. The good thing about Jim's work is that you can adapt it to fit your trading plan and your personality. You must experiment and find out what works for you and your trading plan. It is a trade off, close stops, more stop outs, larger stops, increased risk, less stop outs. I prefer close stops and re-entry.