MyPivots
Sign In
DU
Duane
Rep: 100
Posts: 1,095
Hi Jim,

Thanks for opening this Forum to your students and giving us an opportunity to show our charts and share our ideas.

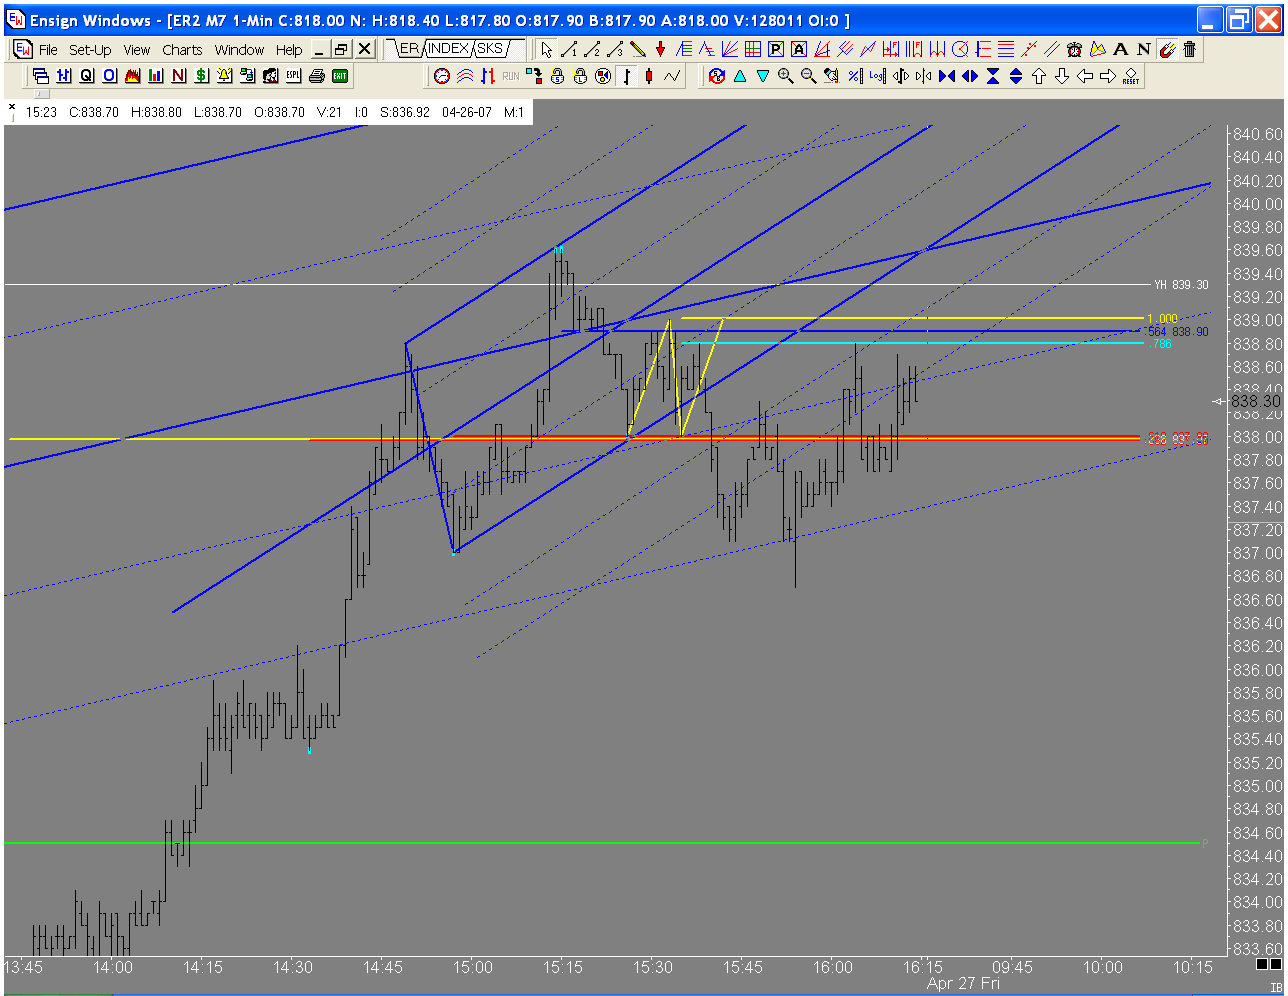
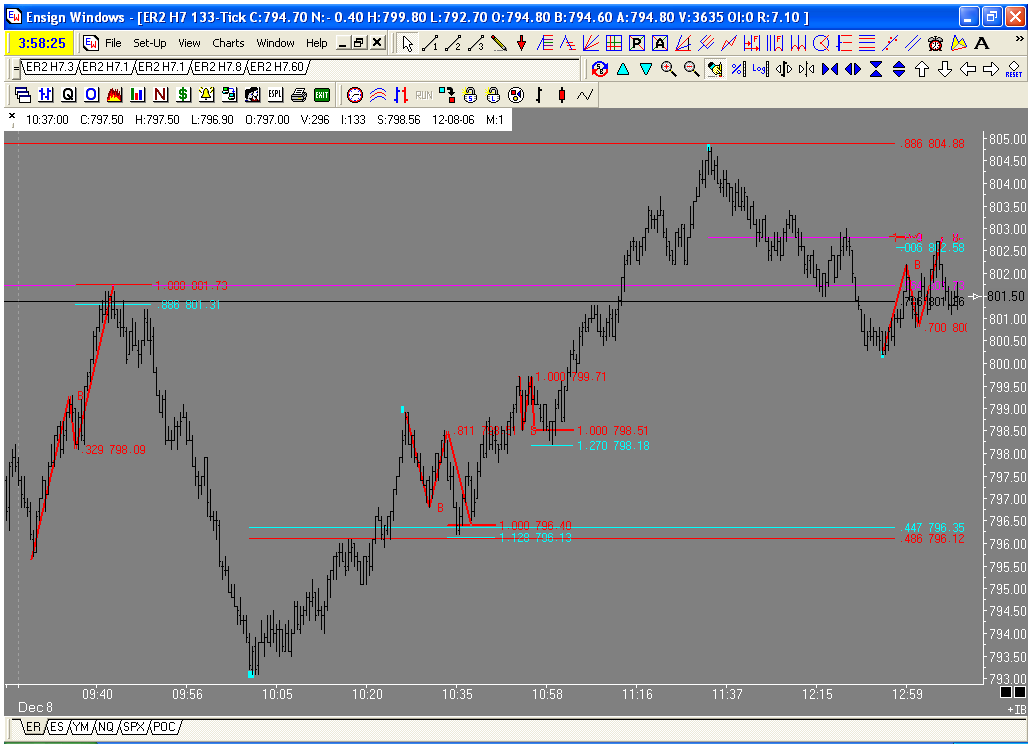
Here is a chart of todays ABCD's in the russell. I will post a context chart later. Today was one of those days where the market changes direction on Jim's unique Fib numbers, Had you been trading with standard fib numbers you may not have noticed these PTA's. Is it me or is .564 becomming more and more prevalent?

Click image for original size
No Description Entered
JI
jimkane
Rep: 3,058
Posts: 33,089
quote:
Originally posted by mreiserer

Very cool.
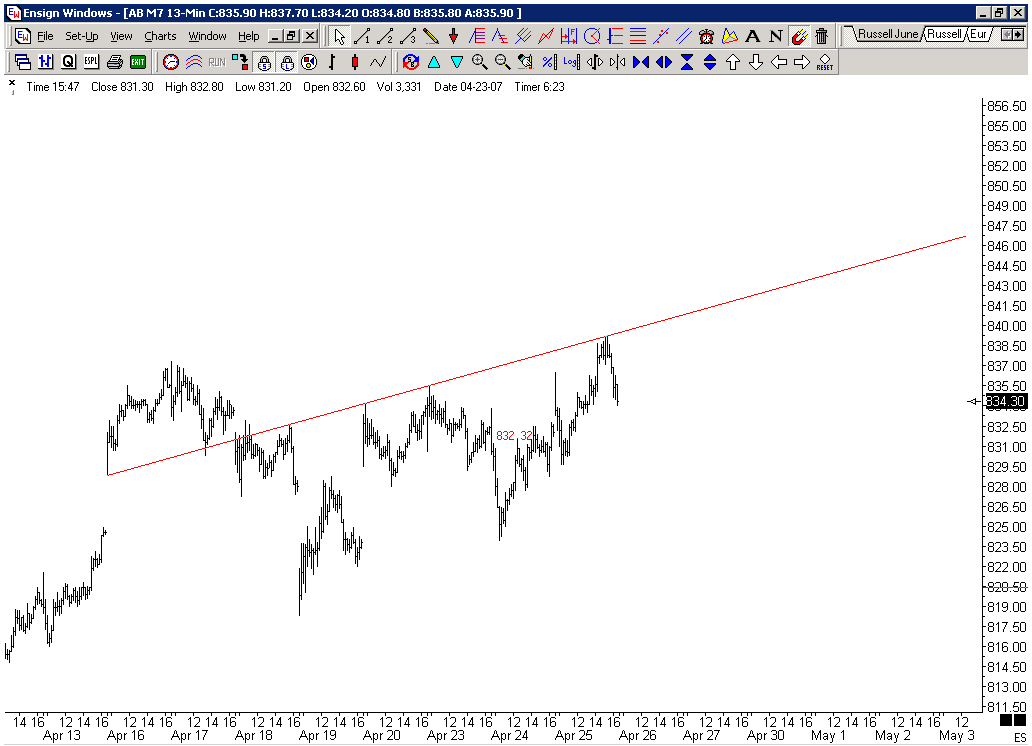
At what point do you 'believe' in a line like this?
In other words. Is the line already trustworthy to you before price hits it on 4/20 after the gap up?


Click image for original size
No Description Entered


I use them 'untested' in most cases, but only as supplemental information. Of course, once 'tested' they have additional value to me. I also use them to point to possible areas, and then I do the more traditional work and see what I might be able to come up with. Many times they give me ideas about possible premises I might otherwise not think of.
JI
jimkane
Rep: 3,058
Posts: 33,089
quote:
Originally posted by Duane

Crazy trendlines are definatly an art that is aquired with lots of screen time IMHO


I agree. I am definitely looking at, and for, very specific things, but like I was when I first started writing the books, I'm not really sure exactly what it is, consciously. If I thought about it a lot, like when I write up a topic, I usually understand it better myself, as far as explaining it. But I do show it quite a bit when mentoring, so I do have enough of a handle to explain it one-on-one.
JI
jimkane
Rep: 3,058
Posts: 33,089
What a coil!
MR
mreiserer
Rep: 110
Posts: 2,220
Thanks Jim for the explanation.
Looks like this is ready to explode.
JI
jimkane
Rep: 3,058
Posts: 33,089
This looks like it has done its thing for the day, but watch 38 even here for clues.
MR
mreiserer
Rep: 110
Posts: 2,220
Nice 4pt CP on the tick chart before the rampers came in.


JI
jimkane
Rep: 3,058
Posts: 33,089
Just look at that timestamp! It was at 38 half when I posted that, and it went right to 38 even, to the tick, and jumped right up 9 ticks. .236, .382, .618 all at the same exact spot, with a TD ABCD whose ML lower// hit not only at the same price area, but at the time factor it was headed right for. That 9 ticks was a .564 to the tick. Notice, at least by my work as I've laid out, that was a pretty good 'first thrust' area, and one hell of a scalp, too. It corrects, and sets a new high for the move. Even if that's it, it is still amazing to me... (What's the 'context' in here, time to bet for more up???)
JI
jimkane
Rep: 3,058
Posts: 33,089
How did I know softee would explode up on earnings? At least the first reaction.
JI
jimkane
Rep: 3,058
Posts: 33,089
Well, it closed that gap.
DU
Duane
Rep: 100
Posts: 1,095
Nice one Jim


Click image for original size
No Description Entered
RO
roofer
Rep: 3,689
Posts: 3,574
thankyou duane i knew it was back there somewhere...