Hi Jim,
Thanks for opening this Forum to your students and giving us an opportunity to show our charts and share our ideas.
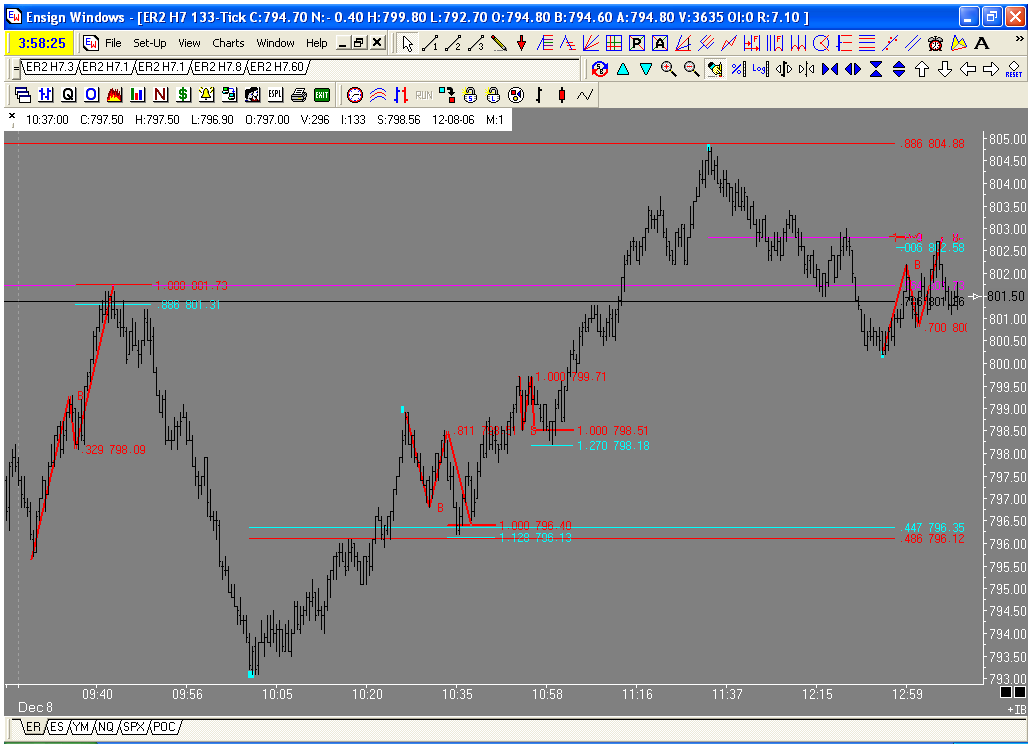
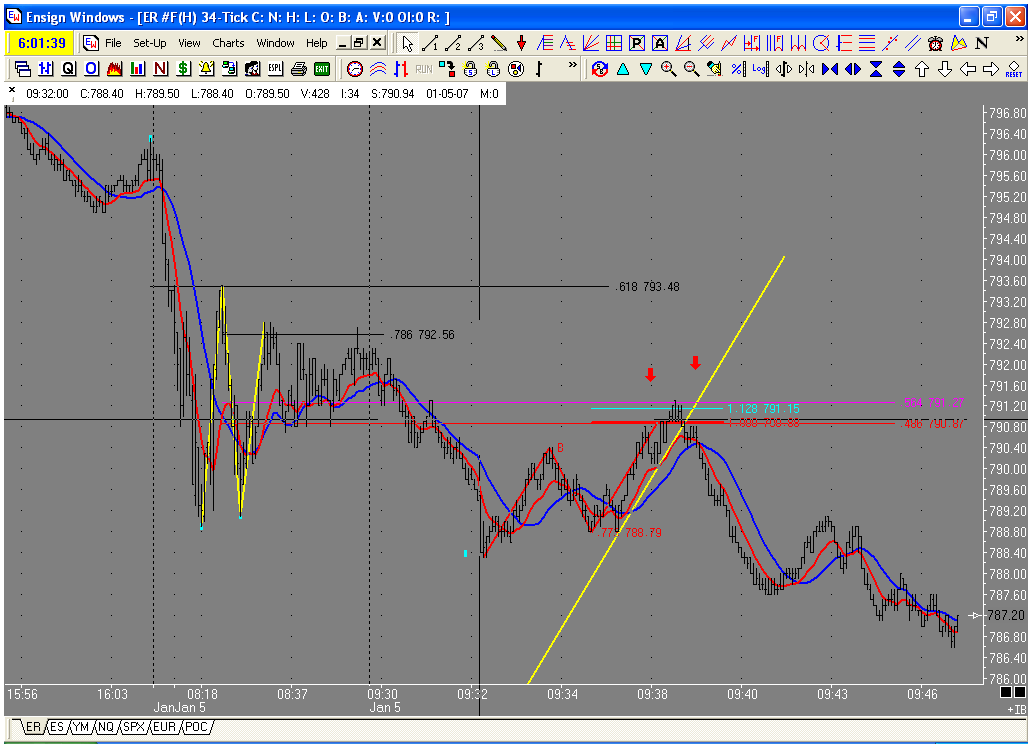
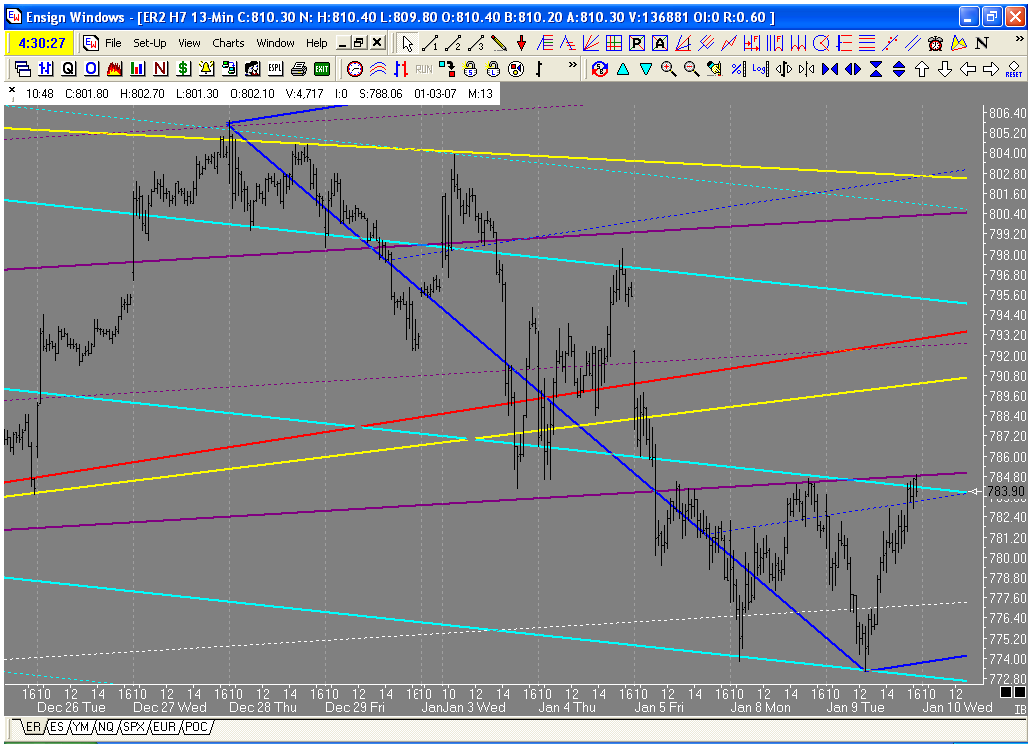
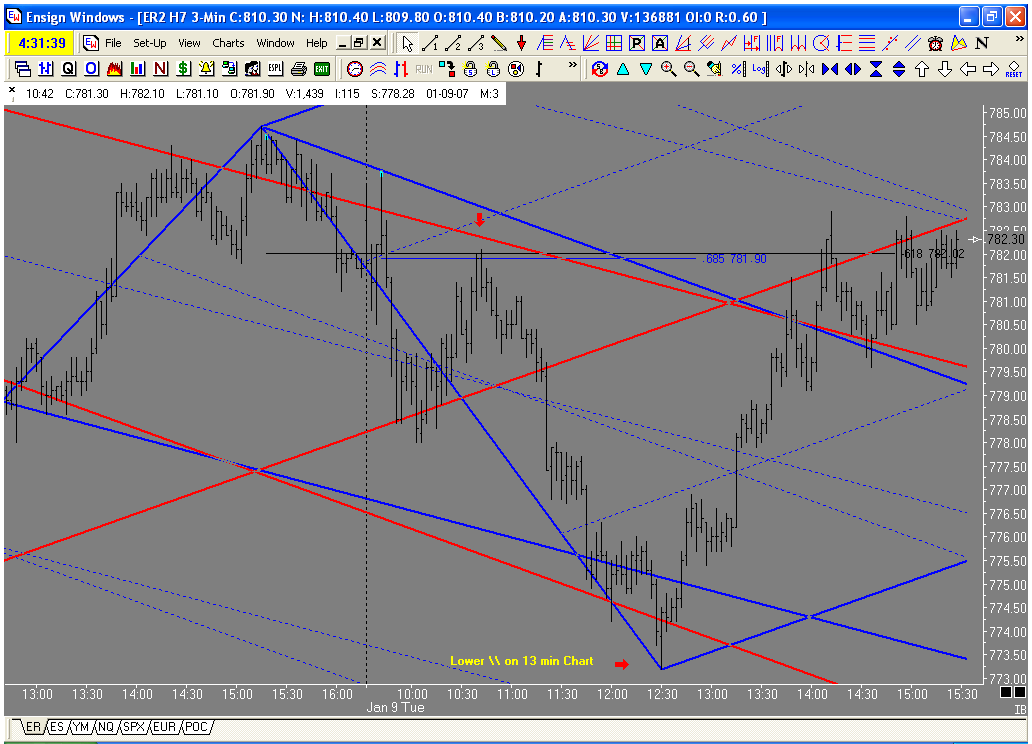
Here is a chart of todays ABCD's in the russell. I will post a context chart later. Today was one of those days where the market changes direction on Jim's unique Fib numbers, Had you been trading with standard fib numbers you may not have noticed these PTA's. Is it me or is .564 becomming more and more prevalent?
JI
jimkane
Rep: 3,058
Posts: 33,089
Yep, they did the same thing they did on the first day in 2000, as I suspected they might. But as per my note from a few minutes ago in the Jim's Thoughts area, notice where they sold it to, and how hard they bounced it. Being able to see that as a potential spot for this big run into the close was 'suh-weet'.
DU
Duane
Rep: 100
Posts: 1,095
"The black trendline across the top is a very obvious one. Zoom out on your own chart and see which one this is. It couldn't be more obvious. I wanted to watch that area and see if the 'stab' above that red median line was more like a 'stop run' of sorts, or a real move with more to go. The trendline would tell me a lot, as would the price action as the area was 'tested'. You should see something very obvious in the price action as it started to react and 'test' that line in those two spots? Do you see it?"
Got ya Jim, cannot close above this level, a powerful clue. I feel a new book coming, Kane Trading on: Trendlines
JI
jimkane
Rep: 3,058
Posts: 33,089
Just because the methodology has a lot of new creations in it, and some are a bit detailed, doesn't mean that the most simple, most obvious things should be overlooked. I am a big fan of the simple. I watch pretty much every possible trendline at all times on all of my working charts, if for no other reason that I want to keep an eye on what 'Joe Average' is looking at.
P.S. I like how you quote the commentary from the perspective of pointing out how what I write is actually specific, and is done to make specific points that show something about the methodology. Most people don't get this at all, I think. You obviously get it, and see that I am trying to do what they call in education 'guided discovery', and when you point it out you show not how 'great' Jim is, but how he is always thinking about ways to guide some discovery, and hopefully if people do the work, they will learn. So, feel free to quote at will.
JI
jimkane
Rep: 3,058
Posts: 33,089
Amazing how often that pre-market tick data gives me something I can work with, eh? Amazing, too, what a difference it makes when there is someone to point things like this out, too. I wish I had someone like me when I first started...
DU
Duane
Rep: 100
Posts: 1,095
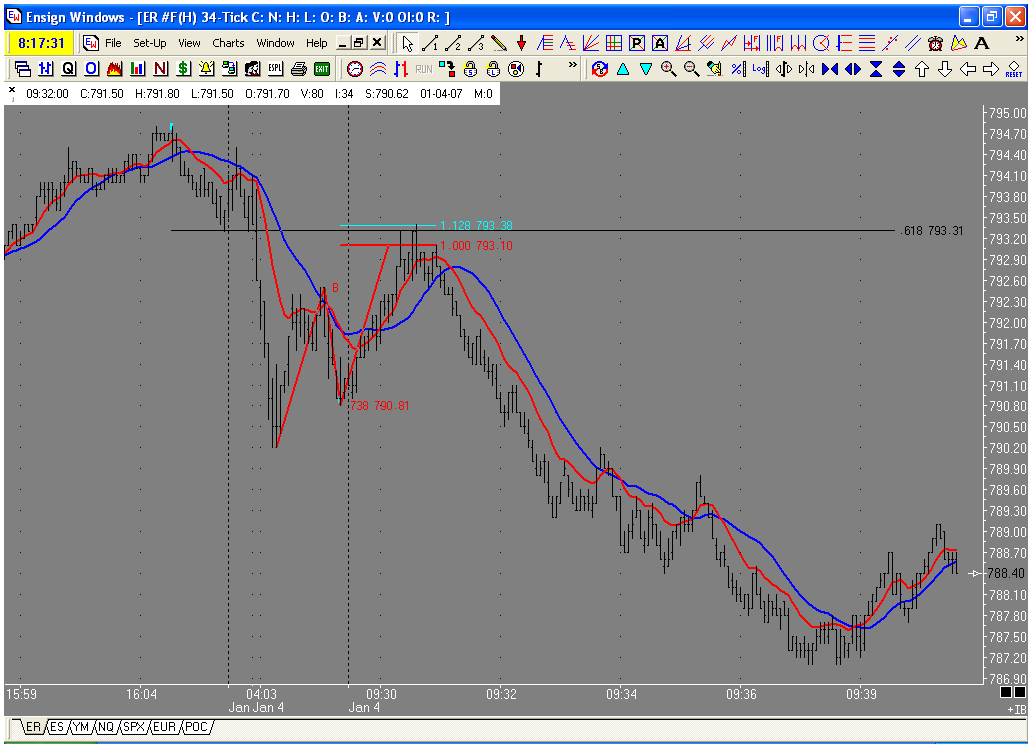
Hi Jim, it makes a BIG difference!! We are all lucky to have you as a teacher! Just look at this action. Pre- market ABCD again!!
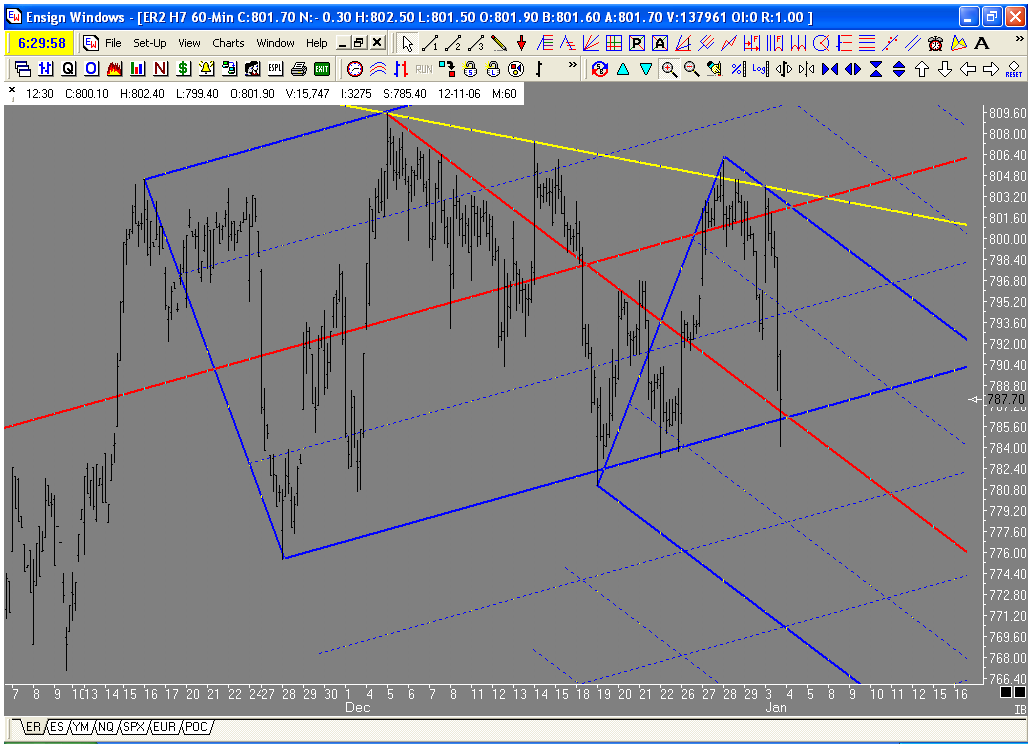
And another ABCD forming on a larger timeframe.
I have been monitoring that cotton trade. It rolled over nicely today and formed another ABCD. Thanks again for the instruction.
And another ABCD forming on a larger timeframe.
I have been monitoring that cotton trade. It rolled over nicely today and formed another ABCD. Thanks again for the instruction.
DU
Duane
Rep: 100
Posts: 1,095
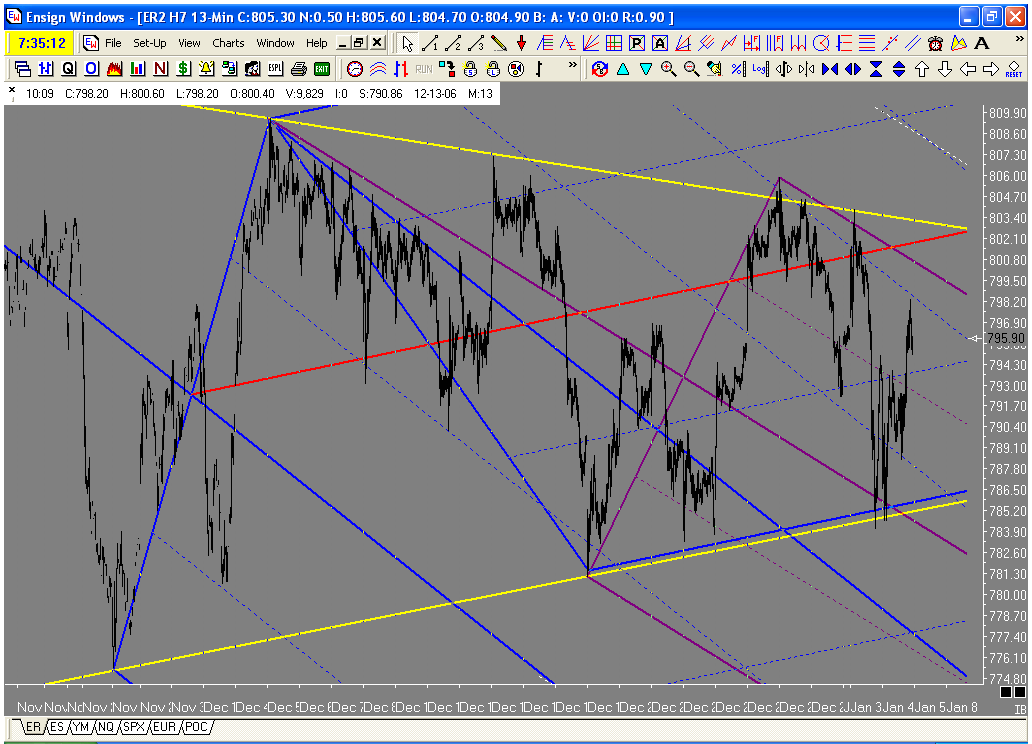
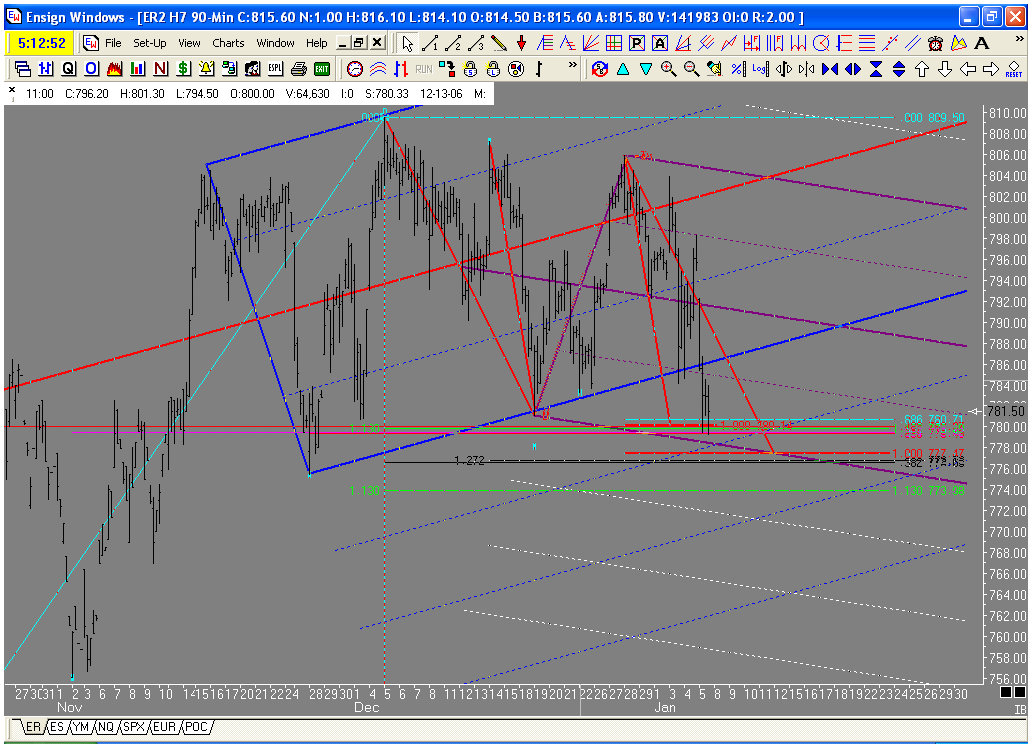
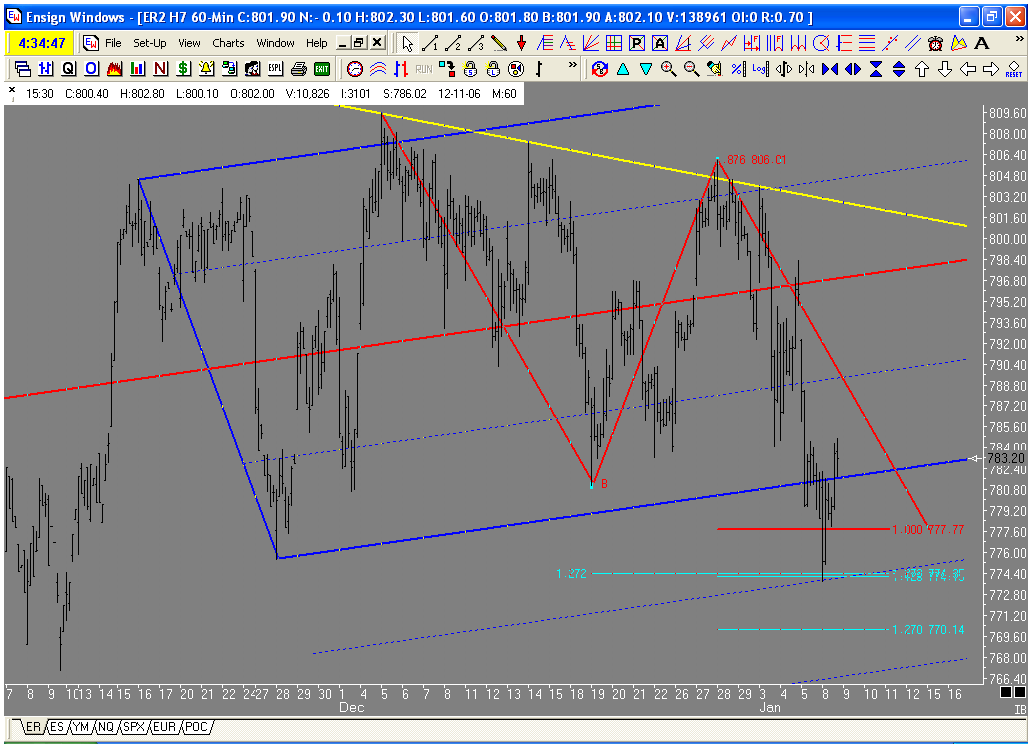
Our trade premiss going todays trading was the completion of the larger ABCD formed on the 90 min chart chart posted on friday. The larger timeframe ABCD and a smaller ABCD were compeleted at the warning line and fib support. In case you missed that trade there was another ABCD later in the day using the Kane adjusted forks. A great day for Kane Traders!!
DU
Duane
Rep: 100
Posts: 1,095
The light blue \\ set is has been working very well. I am looking for support and resistance in the 13min chart, then dial down to lower time frames for fib support and patterns.
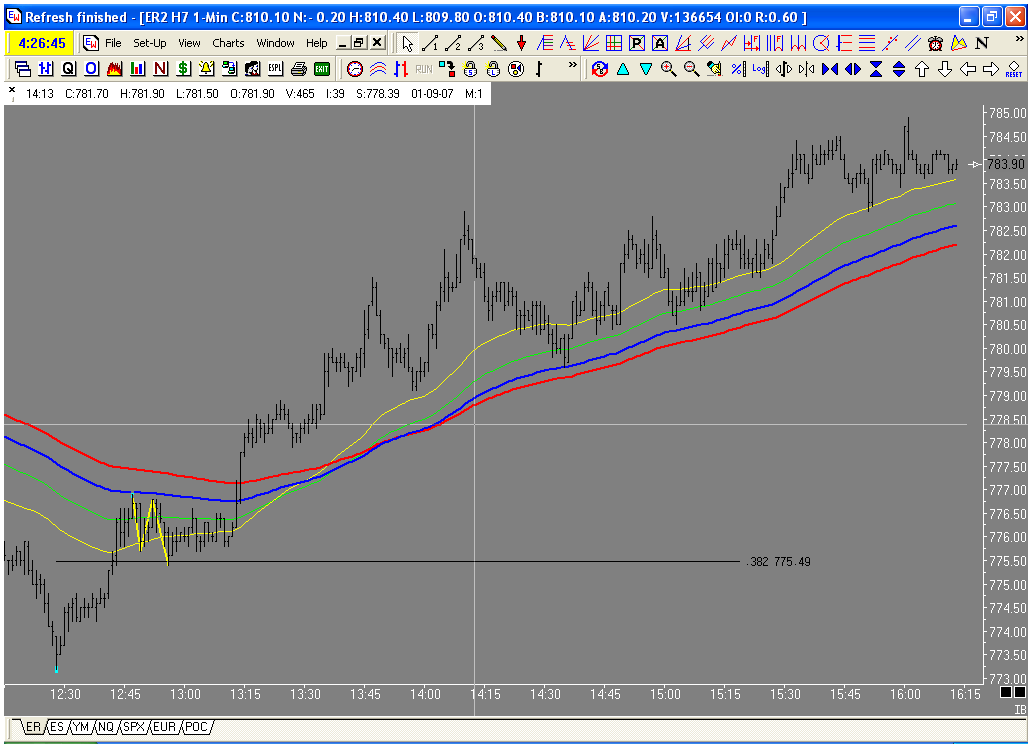
I multiple trailing stop templates. Each has its own use depending on the swing I am trying to catch. Here is a chart of a smoothed MA of the highs. I use the smoothed MA to keep me in trades longer, the downside of this using the smoothed MA is that you give to much back if the market does not run. As Jim says "you can't get something for nothing in the markets or in life".
" Trailing stops are so good they should be illegal"
DU
Duane
Rep: 100
Posts: 1,095
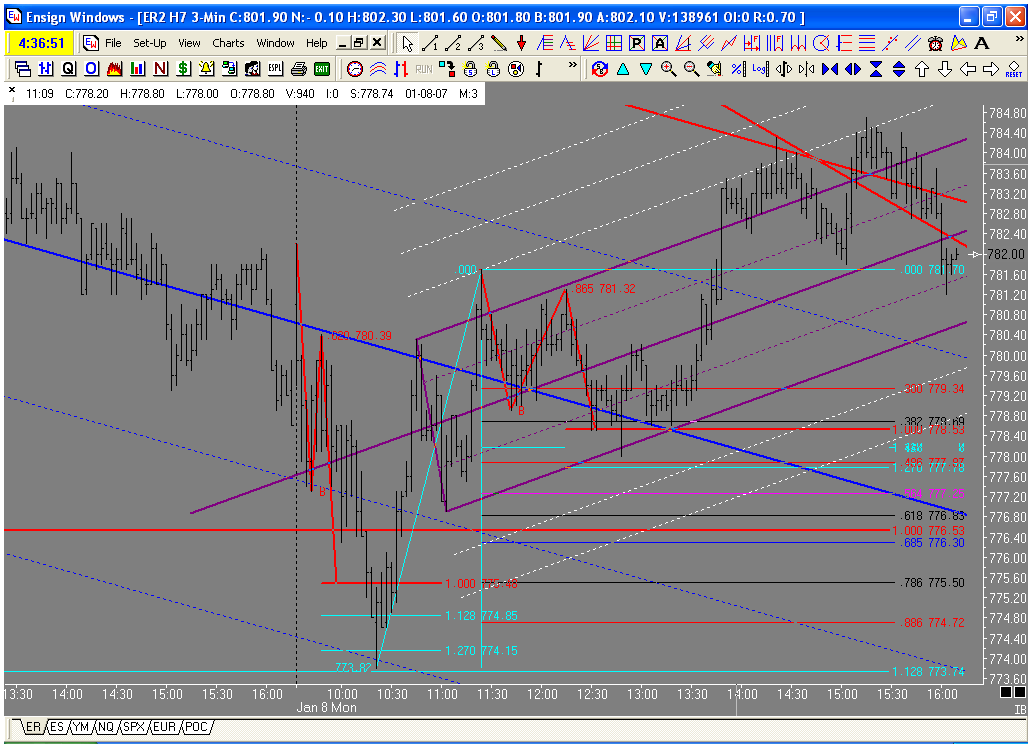
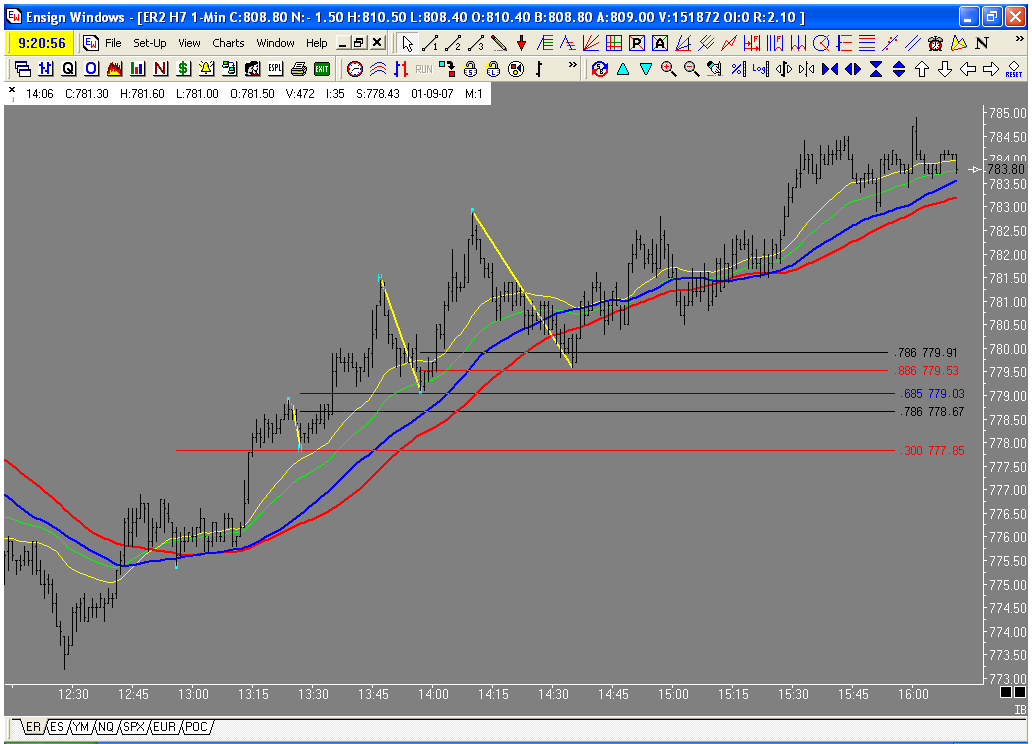
Trade Management is an area that I feel is crucial to a good trading plan. I am exploring ways to maximise profites using the tools that Jim has provided for us. One of the tools that I use regarly is the .786 stop technique. Today when price tagged the lower \\ the ideal target was the median line, but what if it did not reach that Target? How would I make the most of this move? This chart shows my normal stop template in a rising market, it uses simple MA's off the highs. 1st thrust still in nether region, only a .300 pullback. 2nd thrust took two off and .685 pullback .786 stop not threatened. 3rd thrust looks price action looks exhaustive, I might want to look to take another after doji formed, then price pulls back past the .786 and reverses at the .886 this would have taken me totally out of the trade. The market then forms a Kane continuation pattern and resumes its run. It is crucial that the size of the swing that you are trying to catch is well defined before the trade is put on.