anyone trying shorts??
Up here at 845 ES....S&P is holding back this rally today...where the HECK is my plus or (hopefully) minus 8 - 10 range? has everyone gone to 24 hour trading???
- Page(s):
- 1
- 2
- 3
- 4
- 5
- 6
- 7
- 8
- 9
- 10
- 11
- 12
- 13
- 14
- 15
- 16
- 17
- 18
- 19
- 20
- 21
- 22
- 23
- 24
- 25
- 26
- 27
- 28
- 29
- 30
- 31
- 32
- 33
- 34
- 35
- 36
- 37
- 38
- 39
- 40
- 41
- 42
- 43
- 44
- 45
- 46
got 40.50...right near opening range high...final contract gets 33.75 or stopped at 45.25
a little inverse H&S on 5min chart type pattern "look" FWIW ... with it's low end finding support on the VAL ... I still am on sidelines after the a.m. ... don't have any decent price action levels to work off of and no real feel/sense for a directional bias intraday ... though the 30/60min charts, at this point, have a toppy look to them.
And with the past 2 day run-up ... the 30/60min charts might (I say "might") be working on the right shoulder of a larger time frame H&S if price rolls on over during this p.m. Just some observations.
And with the past 2 day run-up ... the 30/60min charts might (I say "might") be working on the right shoulder of a larger time frame H&S if price rolls on over during this p.m. Just some observations.
Btw ... if the mkt stays strong ... I think Kool had a projection up into the 960's
we'll have a new weekly Ib to work from on todays close too....todays volume profile showing a "sell the rally mentality"...it also showed that last friday until that huge buying spike.......let the seller beware......I wouldn't be surprised to see another test of the 43.75...got nothing working
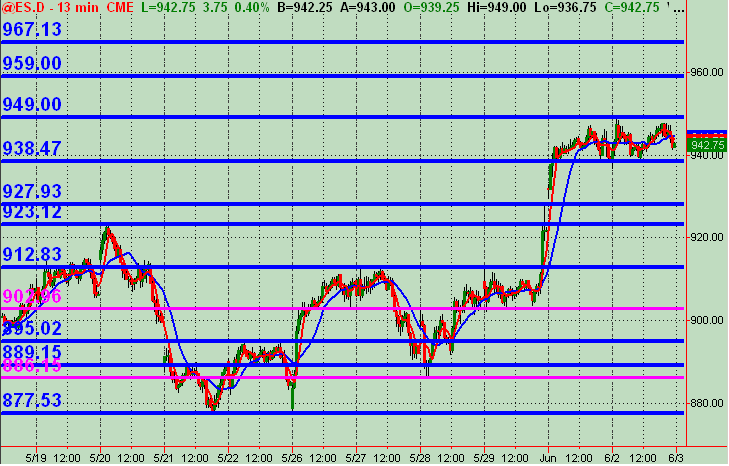
On the bigger time frame, if the ES punches thru 950 ... the next significant levels (based on fib rtc in this case) is 967 and then 975 FWIW ... I ain't a huge fib rtc fan in most cases ... but this is a little more significant on my radar.
With a 60+ point run up in 4 days in a row (each closing up on the session), I'm inclined to see those levels mentioned above as an extreme resistance area ... for at least a short term "overbought" reaction. Wkly R2 is at 958.50 and also taking into account Kool's 60ish projection.
The low of 4 days back was 886.25 ... and with where the mkt is trading now at near it's session high of 949 ... that's over a 7% quick increase. Food for thought I guess.
Thot I'd throw out my 13min chart "map" of Support/Resistance price action levels FWIW coming into Wednesday. Interesting 30 and 60 min charts at close of the session today. May trade tomorrow, but prob will be taking a break (vacation planned). Hope this "map" helps!
As usual Bruce, feel free to kill this chart off whenever you wish, as it takes up a lot of space.
Click image for original size
As usual Bruce, feel free to kill this chart off whenever you wish, as it takes up a lot of space.
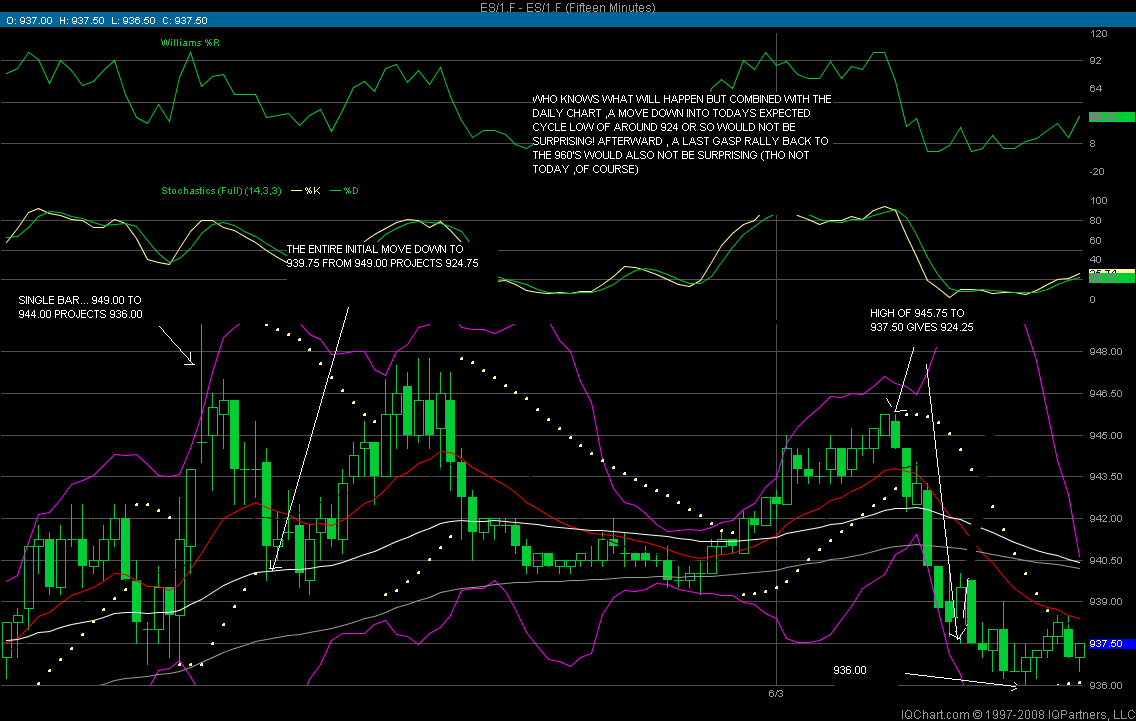
thanks MM.....great work.....today I'm looking for the break of the Monday, Tuesday range.....my bias is still to downside....we also haven't had any minus 4 or minus 8 numbers hit yet this week so I look for that to happen today.....41 - 43 is the HV area over the last two days so that would need to hold back any rally attempt...ultimate target would be last weeks close and the breakout point of 912.75 - 909....fairly grand goals but doable given current weekly ranges...so my work matches yours closely...lets hope someone with more money and power then us has the same plan
18 point range so a break of yesterdays highs goes up to 956 area which coincides with the 960 target you mentioned
18 point range so a break of yesterdays highs goes up to 956 area which coincides with the 960 target you mentioned
the other key range for me will be the 30 - 33 as that incorporates the weekly open, weekly low and near that "air" created on Mondays rally
Click image for original size
Click image for original size
Just about perfect - perfectly wrong that is!
Emini Day Trading /
Daily Notes /
Forecast /
Economic Events /
Search /
Terms and Conditions /
Disclaimer /
Books /
Online Books /
Site Map /
Contact /
Privacy Policy /
Links /
About /
Day Trading Forum /
Investment Calculators /
Pivot Point Calculator /
Market Profile Generator /
Fibonacci Calculator /
Mailing List /
Advertise Here /
Articles /
Financial Terms /
Brokers /
Software /
Holidays /
Stock Split Calendar /
Mortgage Calculator /
Donate
Copyright © 2004-2023, MyPivots. All rights reserved.
Copyright © 2004-2023, MyPivots. All rights reserved.