anyone trying shorts??
Up here at 845 ES....S&P is holding back this rally today...where the HECK is my plus or (hopefully) minus 8 - 10 range? has everyone gone to 24 hour trading???
- Page(s):
- 1
- 2
- 3
- 4
- 5
- 6
- 7
- 8
- 9
- 10
- 11
- 12
- 13
- 14
- 15
- 16
- 17
- 18
- 19
- 20
- 21
- 22
- 23
- 24
- 25
- 26
- 27
- 28
- 29
- 30
- 31
- 32
- 33
- 34
- 35
- 36
- 37
- 38
Click image for original size
...
Closing tick +890
I had two projections 919 & 923 so I'll take the mean 921 that will put me at your 920 Kool.
Thanks
Thanks
ES Support/Resistance levels/zones for Friday’s “map”
Initial mild resistance at Thursday’s high of 908.75. The next upside resistance is comprised of the Wkly R1 near 913.75 which is close to a price action resistance area visited twice intraday on Wed’s RTH trading highs at 912.75 (hit twice to the tick) … with 914 as the Globex high. So, basically the ZONE OF 912.75 – 914.00 AS THE NEXT POTENTIAL SIGNIFICANT RESISTANCE. 918.50 is the next above ... looks like Red and Kool both have a projection avg. a point or two higher, so very nearby!
Minor initial price action support is 900-901, with the next support at a price action level of 895.75 with 894.75 as Wkly PP for a stronger potential SIGNIFICANT SUPPORT ZONE. The next two support levels I have below that are at 891.50 and then 886.25.
This is a “map” for coming into Friday’s trading session for me. AND, price levels are more suspect on a day like Friday where several big reports are coming out: GDP premkt at 8.30am EST … and then CPI and Consumer Sentiment both at 10am EST.
So, keep the powder dry and don't fire until you see the white (or green $$$) of the market's eyes ... random thought that I'm "typing out loud" here to myself. Also, keep an eye on how the NQ and Dow are moving and their S/R areas to align with the ES for highest odds trades.
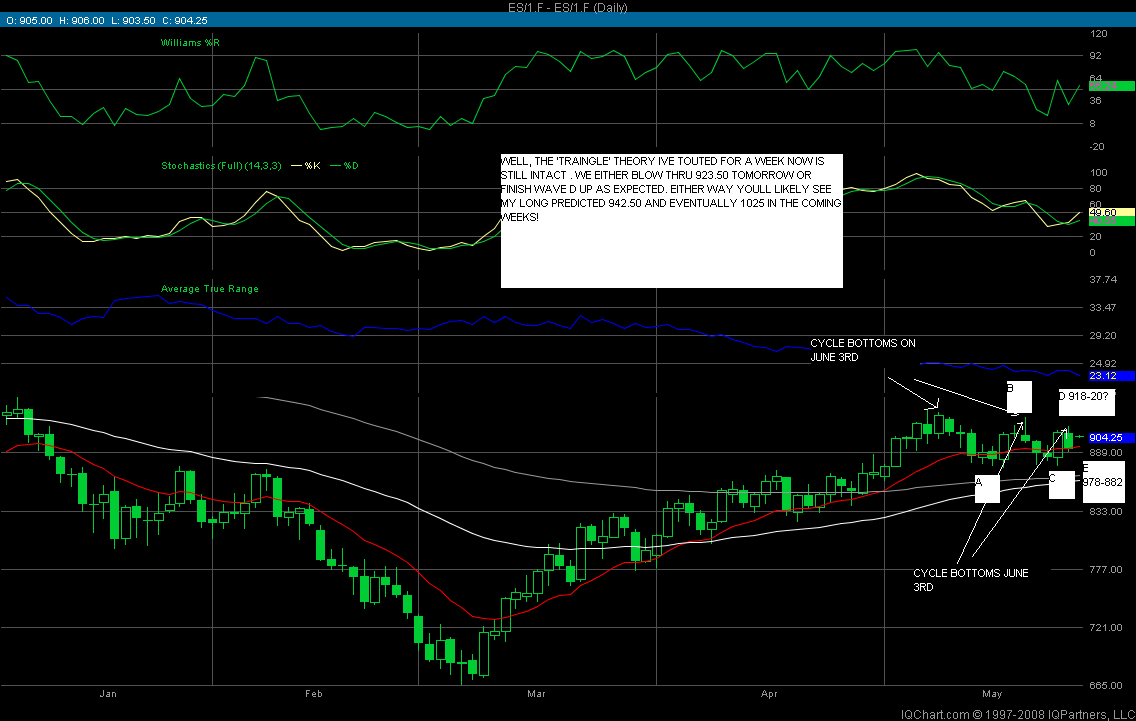
Not gonna post any charts here ... which I have "mapped" out from the prior post above on a 13min and 5min chart. But looking at the daily chart shows contraction ... almost a triangle type formation that others have posted here. And I also was looking at how much the daily bars overlapped each other on the daily and thier ranges. Since the rally began in March, there's only been 3 days of tight contraction mostly overlapping bars (maybe 4 once) before a directional MOVE took place the next day. Then again, this also may harken back to what is a 3 day cycle in the market from Taylor to my own software coding once upon a time. But, with the reports coming out in the morning, it only makes sense I guess. Just more observations. Take a look at the daily chart and there's a small "wedge" that has set up for a Big Bang Friday most likely.
lots of cool overnight numbers and ledges at 07 - 09....then 02.50.........92.50 is key high volume zone now......as usual will be watching previous days range and weekly IB at the 13 - 15 area......my numbers are the same as most here
if they get back above 910 they will go for the 12.75 and the 15 numbers.....and failure will go for the 92.50
if we keep moving up 916 is a so9....fwiw
fakin me out red..nice compression as no run of 30 minute or 60 minute ranges..$ticks are telling me to sell now but no good read yet
2 day V-profile showing P formation...I can't buy any thing else...still partial to shorts.
- Page(s):
- 40
- 41
- 42
- 43
- 44
- 45
- 46
- 47
- 48
- 49
- 50
- 51
- 52
- 53
- 54
- 55
- 56
- 57
- 58
- 59
- 60
- 61
- 62
- 63
- 64
- 65
- 66
- 67
- 68
- 69
- 70
- 71
- 72
- 73
- 74
Just about perfect - perfectly wrong that is!
Emini Day Trading /
Daily Notes /
Forecast /
Economic Events /
Search /
Terms and Conditions /
Disclaimer /
Books /
Online Books /
Site Map /
Contact /
Privacy Policy /
Links /
About /
Day Trading Forum /
Investment Calculators /
Pivot Point Calculator /
Market Profile Generator /
Fibonacci Calculator /
Mailing List /
Advertise Here /
Articles /
Financial Terms /
Brokers /
Software /
Holidays /
Stock Split Calendar /
Mortgage Calculator /
Donate
Copyright © 2004-2023, MyPivots. All rights reserved.
Copyright © 2004-2023, MyPivots. All rights reserved.