anyone trying shorts??
Up here at 845 ES....S&P is holding back this rally today...where the HECK is my plus or (hopefully) minus 8 - 10 range? has everyone gone to 24 hour trading???
quote:
Originally posted by MonkeyMeat
56.75 is low of 4/17 and looked like a decent intraday support area on 5min chart(from 4/17) that's
now possibly good resistance level ... especially considering it's the close of gap on daily chart(RTH)
... also Wkly and Daily Pvt at 56-57 area
Thanks MonkeyMeat; I overlooked the 56.75 low / I had tunnel
vision watching the square of 9 in that area
well done......cool day today...volume profile is showing the "P" pattern so I can do anything but sell rallies untill proven wrong of course...LOL
last try is from 57.75......very risky and small package up here..will try for the 54 area first if we can fail at dva high
Irregular top b wave off of the fifth. They usually double bottom and range for a good ascending triangle, where there'll be three, before a five wave, what Elliot calls, thrust. Same principle applies to the third wave throw-over.
Micro within macro: it likely wont double bottom, overshooting and spending energy basing, and the fifth will most certainly peter out prematurely.
Self-important gadget tweakers..blah
Micro within macro: it likely wont double bottom, overshooting and spending energy basing, and the fifth will most certainly peter out prematurely.
Self-important gadget tweakers..blah
65.00 attempt perhaps ... mkt is strong and even with reactions off of decent resistance levels has revisited them and the ES mkt has seemed to be well bid today ... and back above 8000 on Dow ... on sidelines and drilling down again into charts and heavily weighting strength of rally on daily that's had only 30-50 ES point pullbacks during past apprx 7 weeks ... each time lasting only 1-3 days. Red, I need to catch up on the "square of 9" ... and probably pay more attention to MP dynamics. Nearing bond closing time here.
scratched this at 57.50........just a bad feeling and no real reason....2 standard deviation off of VWAP comes in at 59 now....they may try to tag that...
Towards the sun set, calm tides of the blood-bloated hog drunkards in the eye of the storm.
Oh there's a storm when stormy's awake.
The optimism is skin deep.
watch..your..money..
Oh there's a storm when stormy's awake.
The optimism is skin deep.
watch..your..money..
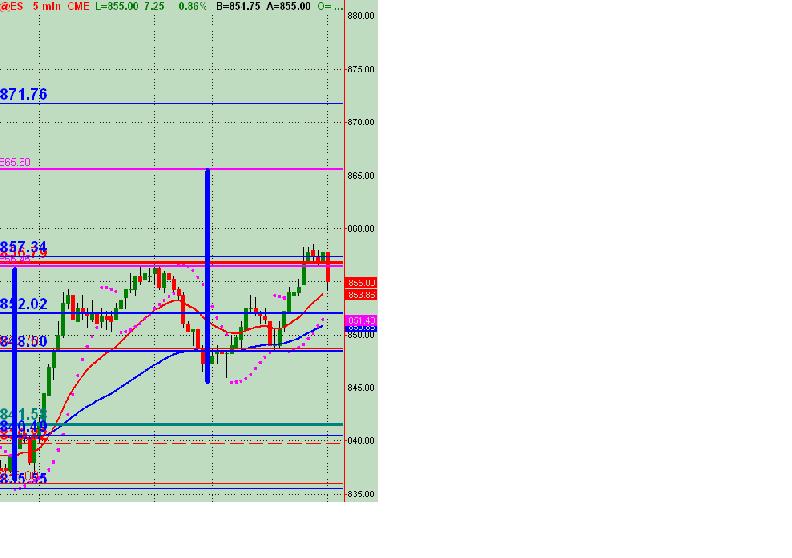
If mkt is (was?) to challenge 65.00, needed to hold above 56.00 which
it's now currently broken below. I had put a "measured move" from
the morning lows to midday highs which is the first thick blue
vertical line on the chart ... displacing that to the intraday
pullback low projected 65.00 apprx ... another think I was looking at
for a potential run to that area where a daily resistance pvt also
lies. With break below 56.00 may be irrelevant for today, but
thought I'd go ahead and post the chart ... who knows, there's still
some time before mkt closes.
Click image for original size
SPQR ... If we had some ham ... we could have some ham and eggs ... if we had some eggs! Don't quite know how to chart that though, even though they're definitely commodities. We could always pairs trade 'em ... just an idea. Will post an egg and ham pairs chart after mkt. Good stuff!
You're alright. Bruce can get hit by a bus. But we'll keep you around. If only to crack jokes for a false sense of purpose and troop morale. I like a joke doing a page's turn. Hang in there.
- Page(s):
- 12
- 13
- 14
- 15
- 16
- 17
- 18
- 19
- 20
- 21
- 22
- 23
- 24
- 25
- 26
- 27
- 28
- 29
- 30
- 31
- 32
- 33
- 34
- 35
- 36
- 37
- 38
- 39
- 40
- 41
- 42
- 43
- 44
- 45
- 46
- 47
- 48
- 49
- 50
- 51
- 52
- 53
- 54
- 55
- 56
- 57
- 58
- 59
- 60
- 61
- 62
- 63
- 64
- 65
- 66
- 67
- 68
- 69
- 70
- 71
- 72
- 73
- 74
Just about perfect - perfectly wrong that is!
Emini Day Trading /
Daily Notes /
Forecast /
Economic Events /
Search /
Terms and Conditions /
Disclaimer /
Books /
Online Books /
Site Map /
Contact /
Privacy Policy /
Links /
About /
Day Trading Forum /
Investment Calculators /
Pivot Point Calculator /
Market Profile Generator /
Fibonacci Calculator /
Mailing List /
Advertise Here /
Articles /
Financial Terms /
Brokers /
Software /
Holidays /
Stock Split Calendar /
Mortgage Calculator /
Donate
Copyright © 2004-2023, MyPivots. All rights reserved.
Copyright © 2004-2023, MyPivots. All rights reserved.