anyone trying shorts??
Up here at 845 ES....S&P is holding back this rally today...where the HECK is my plus or (hopefully) minus 8 - 10 range? has everyone gone to 24 hour trading???
Trailed stop ... tagged out at 907.75 ... gonna take that point and my toys and go home ... done trading for the day.
finally a good short off the key HV zone.....finally a campaign that won.....still net loser on the day so far...gonna need a bigger tanking then that to recoup......c'mon 91 - 93...gonna take another small miracle....first reall sign of some...not much selling interest...watching to see how $ ticks do here
there is a lower high in ticks and good downside volume......I hate trend days..
ES needs to solidly break below and hold below 905 and Dow below 8450 to draw in more selling ... just my opinion.
sure seems that way MM...$ticks made lower highs and then higher lows.......not gonna do what I need to help reduce the loss today....only good thing about trend days is that it usually sets up some good two sided trade the next day
today was a good lesson ( in retrospect) at how the 60 minute high can be looked at in relation to tests and 30 minute closes.........a lesson I need to re learn...lol....knowing what type of day helps....and where the open print is. Compare friday and the opens , 60 minute highs and 30 minute closes......;look at the difference between that and today
quote:
Originally posted by redsixspeed
gm Bruce;
You have 914 area on your radar today?
This 914 showed up on my radar Friday. Anyone see this area
as a target for tonight or tomorrow
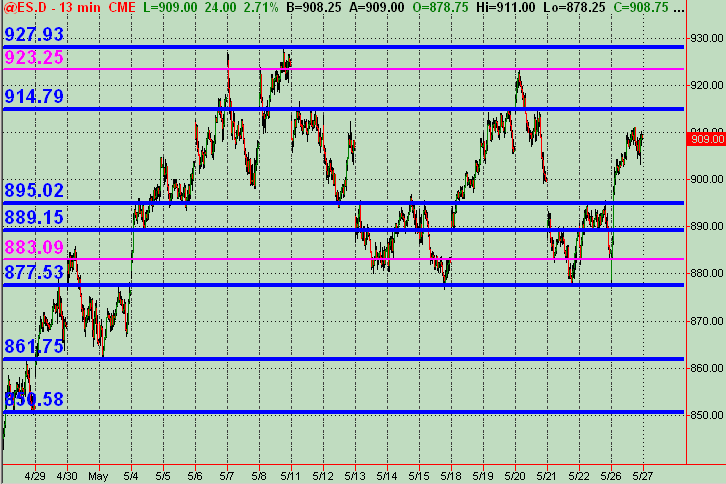
Red, I've got 914-915 that I've had as price action resistance level since either late last week or Friday as a pretty significant level ... was looking at it and posted it a couple times on this thread earlier. Didn't quite get there as of yet today (Tues) ... but am and will be watching that area.
Yeah Bruce, that's always my million dollar Q ... is it a trending type of day or morning ... or more of a range day. At least 70+ percent of time it's non-trending or only semi-trending which, like you, I prefer to trade since the "odds" are there ... at least for how I see/read the mkt usu. Hope your day ended up decently!
This is my 13 min chart I use for finding price action Support/Resistance levels (or areas). The Blue thick lines are more significant, while the thinner Magenta lines are semi-significant. Again, this is just part of a map for coming into the trading night and next day's session. These are simply "potential" halting or reversal price areas as an overall "guide." Since we were talking price levels, I thought I'd include it here in the thread. And I've also got a .786 fib rtc at roughly 913.50, from the RTH high of 5/20 and low of 5/21 FWIW. And, if looking at Ewave type count ... may be considered in a W4 after the W3 run up this mornin'. Just some observations
Bruce, feel free to kill off the chart or move it to another more appropriate thread at your discretion!
Click image for original size
Bruce, feel free to kill off the chart or move it to another more appropriate thread at your discretion!
- Page(s):
- 31
- 32
- 33
- 34
- 35
- 36
- 37
- 38
- 39
- 40
- 41
- 42
- 43
- 44
- 45
- 46
- 47
- 48
- 49
- 50
- 51
- 52
- 53
- 54
- 55
- 56
- 57
- 58
- 59
- 60
- 61
- 62
- 63
- 64
- 65
- 66
- 67
- 68
- 69
- 70
- 71
- 72
- 73
- 74
Just about perfect - perfectly wrong that is!
Emini Day Trading /
Daily Notes /
Forecast /
Economic Events /
Search /
Terms and Conditions /
Disclaimer /
Books /
Online Books /
Site Map /
Contact /
Privacy Policy /
Links /
About /
Day Trading Forum /
Investment Calculators /
Pivot Point Calculator /
Market Profile Generator /
Fibonacci Calculator /
Mailing List /
Advertise Here /
Articles /
Financial Terms /
Brokers /
Software /
Holidays /
Stock Split Calendar /
Mortgage Calculator /
Donate
Copyright © 2004-2023, MyPivots. All rights reserved.
Copyright © 2004-2023, MyPivots. All rights reserved.