I thought I might try something different here, and see how it goes. It's quite difficult for me to post a lot to the various topics, especially with charts, since the method I use for posting charts is very cumbersome. Some charts can take me a half hour or more to put together. Since the charts I use for posting are not my 'working' charts, this work is duplicative.
I have various ideas and thoughts here and there about different things, and if I have a 'central clearing area' where I can just put out a sentence or two, pointing to something without doing the work, the members can do what assessment and analysis they want with the ideas, and post charts if they want, preferably to the respective areas they have for that topic. This way it would leave this topic more 'clean'. If you have a question or comment on what I was pointing out you could post that in here.
Let me know if you have any thoughts on this, or anything you think would be helpful/useful. Keep in mind I am not going to just tell you all my best setups in advance, especially if I plan to trade them, as that is not 'what I do' in here, or anywhere. I want to point out things that may need some work, and might go unnoticed otherwise, or are just of interest.
MR
mreiserer
Rep: 110
Posts: 2,220
I do use the FXCM feed in Ensign just to know what's going on, although I am not interested in trading the FX market again. The feed is ok. I've seen better and more reliable, but the price is good. It's enough if you wanted to trade the bigger swings.
JI
jimkane
Rep: 3,058
Posts: 33,089
quote:
Originally posted by jimkane
GOOG is just going nuts here. It's shooting for the new all-time high, again. Look at that ramp into the close on the 1-min. Wow. Look at stocks like BIDU, and RIMM. And some say speculation is dead...
GOOG sure did continue that rush up.
JI
jimkane
Rep: 3,058
Posts: 33,089
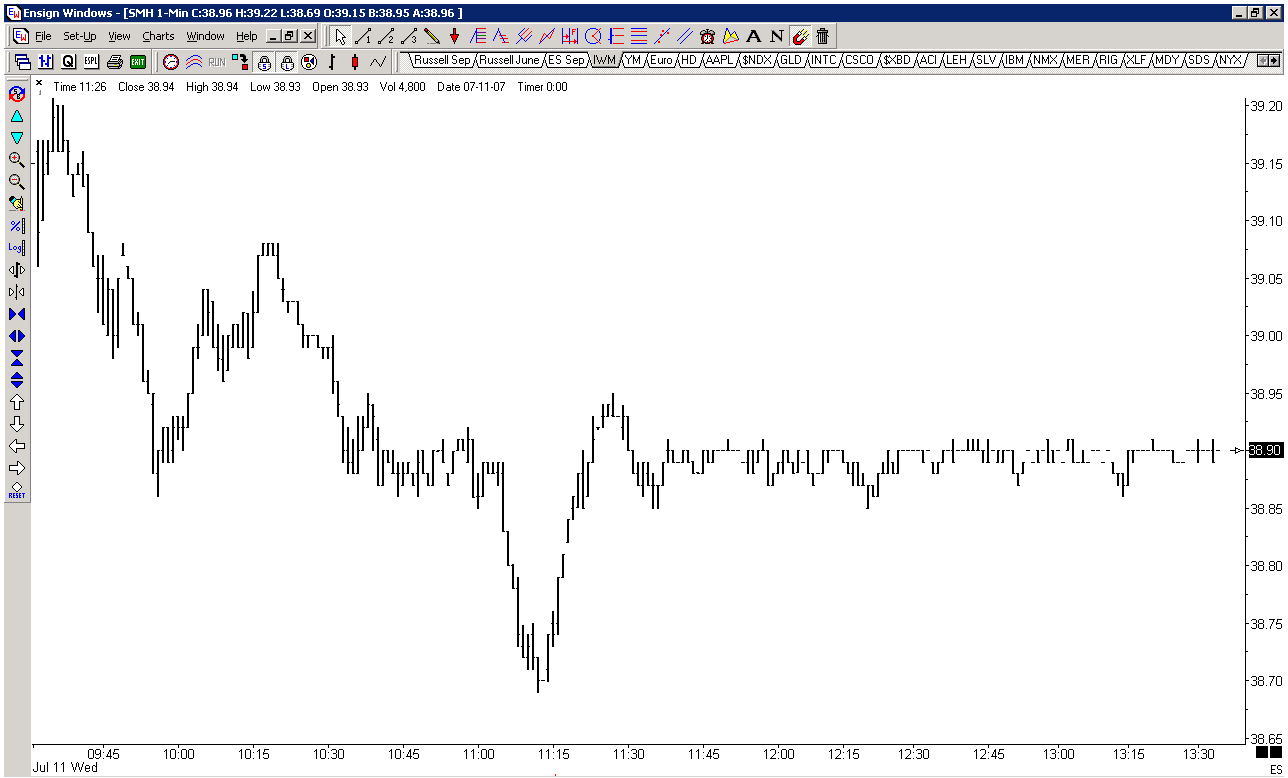
Can someone post this little lesson for me? Do a chart of the SMH, on the 1-min timeframe. Do it from today's open until 13:35 eastern. Make sure the scale of the high and low come close to filling the chart, and that the only data on the chart is just from the times indicated here. Now observe what happens at 11:30. I'm not saying I never trade during the mid-day, but I take into account, especially in the summer months, that this is a common situation. It matters little to swing trading plays, but it is everything on short-term intraday plays.
MR
mreiserer
Rep: 110
Posts: 2,220
Golf anyone?
Do you ever take a vacation Jim?
Do you ever take a vacation Jim?
Click image for original size
JI
jimkane
Rep: 3,058
Posts: 33,089
Is that just a classic example, or what? Two hours of great movement and action, followed by the flat line of death. Notice the Russell didn't get quite so bad.
As far as vacations, well, I went years and years and years without any vacations. Then I finally decided I must take two weeks each summer. I recall that first time watching on TV as the INDU moved 700 points straight up, and I was 'relaxing'. I did take my vacation every summer after that, usually up here. Then I moved to my vacation spot, literally right to it. I'm not sure if that's good or not, but now I work as much as ever. It just looks a lot prettier out the window :-)
As far as vacations, well, I went years and years and years without any vacations. Then I finally decided I must take two weeks each summer. I recall that first time watching on TV as the INDU moved 700 points straight up, and I was 'relaxing'. I did take my vacation every summer after that, usually up here. Then I moved to my vacation spot, literally right to it. I'm not sure if that's good or not, but now I work as much as ever. It just looks a lot prettier out the window :-)
JI
jimkane
Rep: 3,058
Posts: 33,089
Hmmm, INDU up almost 300, smokin' the old all-time highs, all this started just about dead off a classic setup, as did just about all the indices, and not one single post. Not before the fact, not after. OK, I'm fully in the despair club with roofer :-(
DU
Duane
Rep: 100
Posts: 1,095
Nice chart J, I was about to post the exact same post about no one posting :(
JI
jimkane
Rep: 3,058
Posts: 33,089
Well, if that wasn't the best trading day I've seen, it surely was the best in recent memory, and surely in my top handful. Smooth, nice moves off areas I was watching, with lots of follow through. I'm thinking of the Russell mini specifically, but the market in general, too. Oh, if it could only be like this every day...
I was just musing about whether that was the final cyclical bull top there. As everyone knows, I don't call tops, and don't make any predictions, and don't feel they are necessary for my 'Trading Plan'. I was just having a little fun wondering if that was it. As I've said before, I can't wait to see, once this all plays out, what the position of the market now actually was, you know, with oil ready to potentially explode, Cap'n B saying sub-prime may be $100 billion and affect the economy after all, all the deep secrets of the over-leveraged hedge funds coming out, rates breaking the appx. 26 year downtrend, and so on. Just something I can't wait to look back on, and say 'I was there...'
I was just musing about whether that was the final cyclical bull top there. As everyone knows, I don't call tops, and don't make any predictions, and don't feel they are necessary for my 'Trading Plan'. I was just having a little fun wondering if that was it. As I've said before, I can't wait to see, once this all plays out, what the position of the market now actually was, you know, with oil ready to potentially explode, Cap'n B saying sub-prime may be $100 billion and affect the economy after all, all the deep secrets of the over-leveraged hedge funds coming out, rates breaking the appx. 26 year downtrend, and so on. Just something I can't wait to look back on, and say 'I was there...'
JI
jimkane
Rep: 3,058
Posts: 33,089
I have a lot of things, lines, Fibs, pattern(s), and such coming together in here on the Russell, from weekly, daily, and lower. If this doesn't produce a reversal or a bounce, I'm thinking possible 'wave 3' and not CD leg completion. I see this as a key area for information. I'm seeing things in other indices, too. Tomorrow may be quite telling, and hopefully exciting. Sometimes they just go to sleep for a bit after such a pommeling.
JI
jimkane
Rep: 3,058
Posts: 33,089
Another big, key higher timeframe area was just hit in the Russell. If this can't bounce it, I'm looking for 'trouble'.
- Page(s):
- 21
- 22
- 23
- 24
- 25
- 26
- 27
- 28
- 29
- 30
- 31
- 32
- 33
- 34
- 35
- 36
- 37
- 38
- 39
- 40
- 41
- 42
- 43
- 44
- 45
- 46
- 47
- 48
- 49
- 50
- 51
- 52
- 53
- 54
- 55
- 56
- 57
- 58
- 59
- 60
- 61
- 62
- 63
- 64
- 65
- 66
- 67
- 68
- 69
- 70
- 71
- 72
- 73
- 74
- 75
- 76
- 77
- 78
- 79
- 80
- 81
- 82
- 83
- 84
- 85
- 86
- 87
- 88
- 89
- 90
- 91
- 92
- 93
- 94
- 95
JI
jimkane
Rep: 3,058
Posts: 33,089
I think the second chart is particularly telling. I agree with the conclusion, this market is nothing more than Euro-yen carry trade on, Euro-yen carry trade off. No balance, no participation, no depth, as I discussed in my last monthly commentary, just leverage/deleverage, risk on/risk off, and that's it. Skynet is totally sentient. How long, like in the movie, until the machines decide to vaporize the useless humans?
http://www.zerohedge.com/article/tale-two-decouplings
http://www.zerohedge.com/article/tale-two-decouplings