I thought I might try something different here, and see how it goes. It's quite difficult for me to post a lot to the various topics, especially with charts, since the method I use for posting charts is very cumbersome. Some charts can take me a half hour or more to put together. Since the charts I use for posting are not my 'working' charts, this work is duplicative.
I have various ideas and thoughts here and there about different things, and if I have a 'central clearing area' where I can just put out a sentence or two, pointing to something without doing the work, the members can do what assessment and analysis they want with the ideas, and post charts if they want, preferably to the respective areas they have for that topic. This way it would leave this topic more 'clean'. If you have a question or comment on what I was pointing out you could post that in here.
Let me know if you have any thoughts on this, or anything you think would be helpful/useful. Keep in mind I am not going to just tell you all my best setups in advance, especially if I plan to trade them, as that is not 'what I do' in here, or anywhere. I want to point out things that may need some work, and might go unnoticed otherwise, or are just of interest.
JI
jimkane
Rep: 3,058
Posts: 33,089
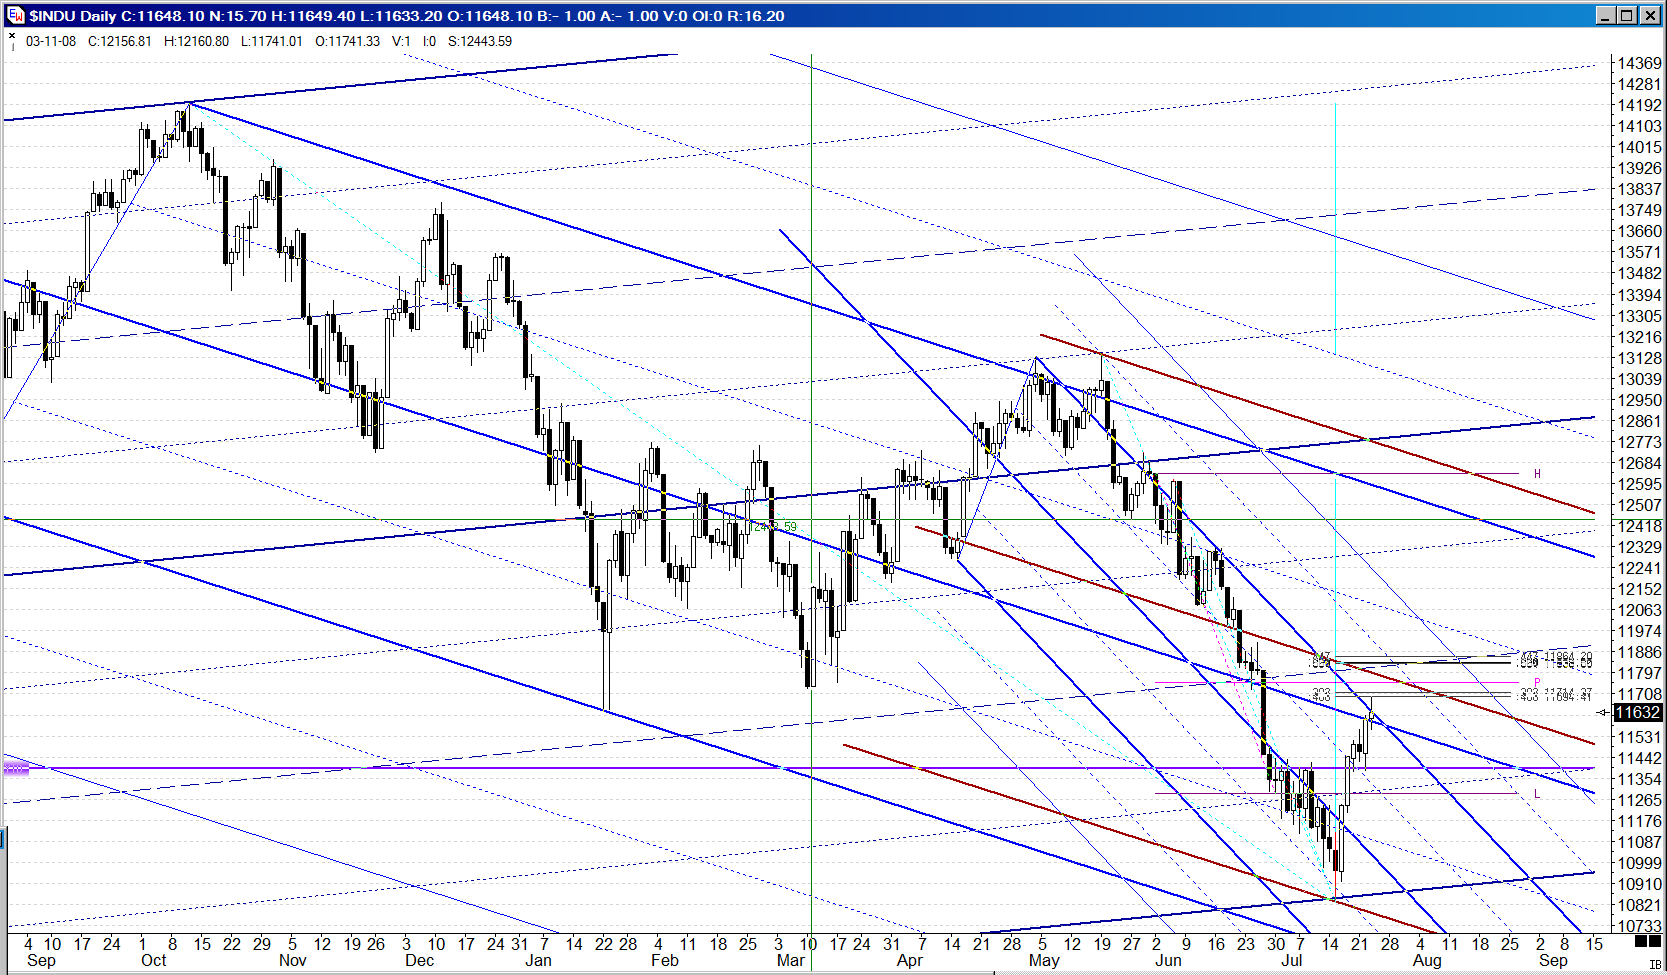
Wow, I'm just blown away. Go to my last commentary dated July 6th. Look at the last chart, for the INDU. Recreate this for yourself, and add on an offset line for that poke above the set on May 19th. Put that above the downsloping set's lower //. Also add on a set from the 4/15 low to the 5/2 high, and adjust it so the second high on 5/19 hits the first outer division line. This is what I had going into the area. The most important line was the upsloping lower // from the weekly set, as shown on the commentary chart. It came as close to dead off that area (and triple line convergence) as possible and is up over 870 points low to high so far.
But it gets better. Do .382 and .447 retracements off the two key peaks, add the same offset line above the downsloping set's ML, add on a division line for that big upsloping weekly set, look at the other downsloping set's upper //, and where do they all hit? The same spot, just overhead. And what happens to fall right into that area? The monthly pivot. Sure wish I had an easy way to chart all this and post it. This is where I hope M is reading this, so he can chart it for us all.
Regardless, that's three months running I posted in the commentary in advance major turning points for the market. I know in here that's no big deal, but to 'the outsiders' that must look pretty cool. I can't get over how the INDU shot straight for that line going back to early 2002, turned on a dime, and rocketed up, and I work on this stuff every day. It just keeps blowing me away.
JI
jimkane
Rep: 3,058
Posts: 33,089
Actually, to get that last, smaller downsloping set right, you have to balance it with not only that outer division line, but the highs and lows from the last week or so of May and the first week or so of June, with that upper // and the upper inner division line, that's how I got that set.
JI
jimkane
Rep: 3,058
Posts: 33,089
There is also a sweet .300, .447, and .564 grouping just over the grouping I mentioned. Boy are we at clue time.
JI
jimkane
Rep: 3,058
Posts: 33,089
I'd say that is about as close as one can get from a verbal description. Very nice. Now we wait and see what's next.
MA
Mats
Rep: 100
Posts: 262
What can I say fantastic !
And so it have been all the week whith the setups
Sweden always overreact to SP500.
Thanks
Mats
And so it have been all the week whith the setups
Sweden always overreact to SP500.
Thanks
Mats
JI
jimkane
Rep: 3,058
Posts: 33,089
Here are two articles I think are really good, if you want to dig into what may be going on with the economy. This is the stuff they won't tell you on 'Talking Head' rah-rah TV. This is the stuff I've been digging up for some time now and discussing in the commentary. I'm not an economist by any stretch, so it seems pretty good to me that I was seeing this stuff so far back.
http://www.investorsinsight.com/blogs/john_mauldins_outside_the_box/archive/2008/08/18/the-elusive-bottom.aspx
http://seekingalpha.com/article/90892-the-great-consumer-crash-of-2009
As always, I'd love to hear thoughts or comments on what is presented there, if you have them.
http://www.investorsinsight.com/blogs/john_mauldins_outside_the_box/archive/2008/08/18/the-elusive-bottom.aspx
http://seekingalpha.com/article/90892-the-great-consumer-crash-of-2009
As always, I'd love to hear thoughts or comments on what is presented there, if you have them.
RO
roofer
Rep: 3,689
Posts: 3,574
all of this is well known...markets move because one side capitulates.who is the most complacent/ the shorts..if things are so bad, why is a large corporation offering to pay my daughters last years tuition if she will work for them for year? if things are so bad, why are my buddies working seven days in supposedly the worst housing city in nation?idont know ... i just trade.is price at a pivot that the geometry and time says is important... do i have a trade signal?the past six weeks have been the golden days for numbers traders as everyone is trading the numbers and no one is commited to one side of the market....it could stay like this forever as far as i am concerned....my 2 cents....
RO
roofer
Rep: 3,689
Posts: 3,574
having done the whine and now having done my weekend prep... i have the same feeling ihad before collapse in feb 07....a quiet open up a little, then a thrust down followed by a collection of kane abcd pattern line fib retraces in the indexes and i would expect all hell to break to the down side...before the break in 07, the geometry was not clear to the average trader, just like now... i spent hours today asking myself is what i am seeing really there?if it is then monday will be the defining moment for the next leg of the market, up or down...
- Page(s):
- 47
- 48
- 49
- 50
- 51
- 52
- 53
- 54
- 55
- 56
- 57
- 58
- 59
- 60
- 61
- 62
- 63
- 64
- 65
- 66
- 67
- 68
- 69
- 70
- 71
- 72
- 73
- 74
- 75
- 76
- 77
- 78
- 79
- 80
- 81
- 82
- 83
- 84
- 85
- 86
- 87
- 88
- 89
- 90
- 91
- 92
- 93
- 94
- 95
JI
jimkane
Rep: 3,058
Posts: 33,089
I think the second chart is particularly telling. I agree with the conclusion, this market is nothing more than Euro-yen carry trade on, Euro-yen carry trade off. No balance, no participation, no depth, as I discussed in my last monthly commentary, just leverage/deleverage, risk on/risk off, and that's it. Skynet is totally sentient. How long, like in the movie, until the machines decide to vaporize the useless humans?
http://www.zerohedge.com/article/tale-two-decouplings
http://www.zerohedge.com/article/tale-two-decouplings