I thought I might try something different here, and see how it goes. It's quite difficult for me to post a lot to the various topics, especially with charts, since the method I use for posting charts is very cumbersome. Some charts can take me a half hour or more to put together. Since the charts I use for posting are not my 'working' charts, this work is duplicative.
I have various ideas and thoughts here and there about different things, and if I have a 'central clearing area' where I can just put out a sentence or two, pointing to something without doing the work, the members can do what assessment and analysis they want with the ideas, and post charts if they want, preferably to the respective areas they have for that topic. This way it would leave this topic more 'clean'. If you have a question or comment on what I was pointing out you could post that in here.
Let me know if you have any thoughts on this, or anything you think would be helpful/useful. Keep in mind I am not going to just tell you all my best setups in advance, especially if I plan to trade them, as that is not 'what I do' in here, or anywhere. I want to point out things that may need some work, and might go unnoticed otherwise, or are just of interest.
JI
jimkane
Rep: 3,058
Posts: 33,089
So, I was saying in the chat room yesterday the 'ideal' would be to roll off that ES ABCD and head down to the key SP area around 1300, give or take, as shown by the lower lines on M's chart that he posted. It rolled right off the small ABCD and sold down, and this morning we are going to open pretty darn close to the 1300 area. The INDU will be not too far above the Jan intraday low. Wow, is it going to bounce? Imagine if all this gives way... What exciting trading times we live in.
JI
jimkane
Rep: 3,058
Posts: 33,089
My key SP lines are just below 1300 cash SP, from 1295-1300. This is a monster area, as far as coming from the higher timeframes. But, the INDU just went under the Jan intraday lows with essentially zero reaction so far, and oil is at the range top, again, acting like it wants to bust out to the upside. If it did, the market wouldn't have a prayer, in my opinion. Although I am watching very closely here, my bias is on the short side going into the area, and it would take some very committed price action to get me to take the area serious for a long side bias. I suspect we are on the verge of a possible big flush. This is typical of 'wave 3' action, and that is what my premise says we are most likely in. Just some thoughts. Price action is king, though.
RO
roofer
Rep: 3,689
Posts: 3,574
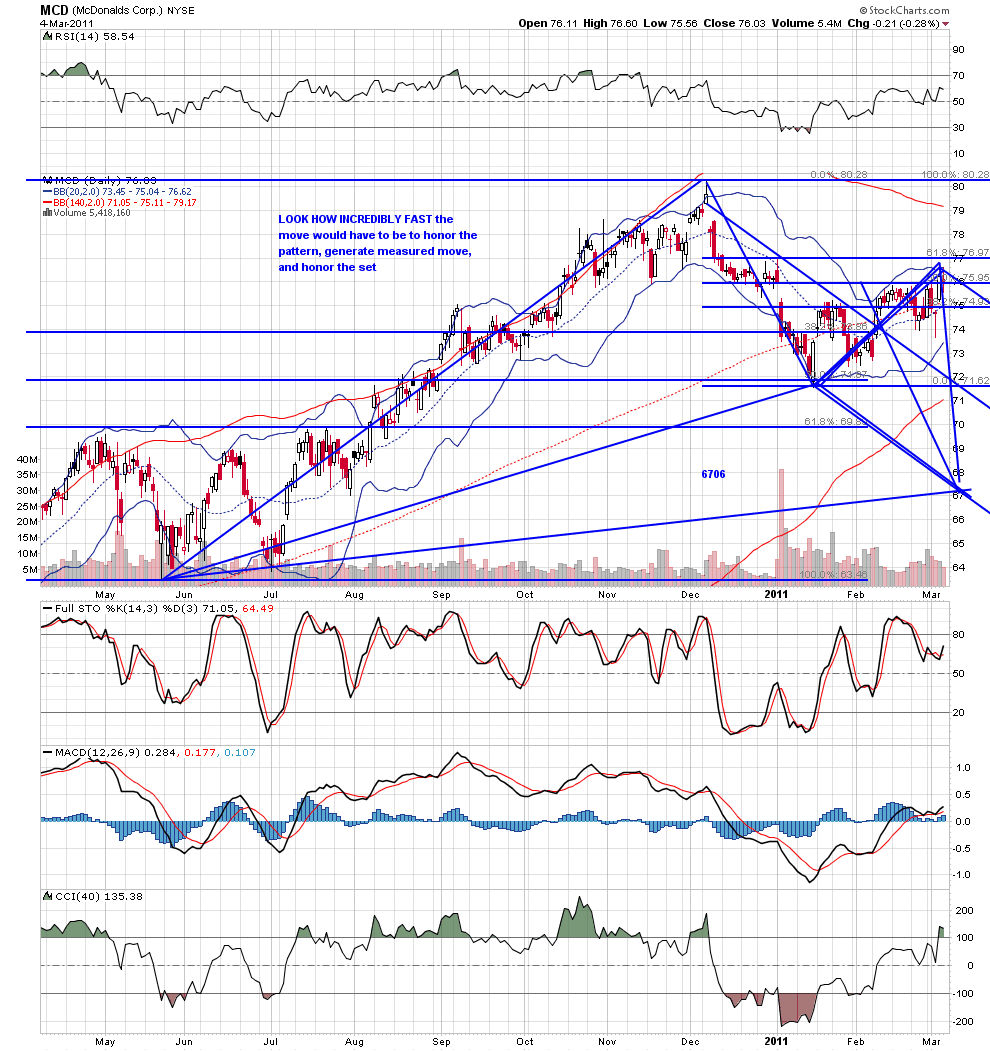
ihope everyone was short coming into today.. at yesterday's high every chart i had gave sell.. it was one of the all time great stacks... and if you missed being short overnight MCD was there to lend a hand..
Click image for original size
RO
roofer
Rep: 3,689
Posts: 3,574
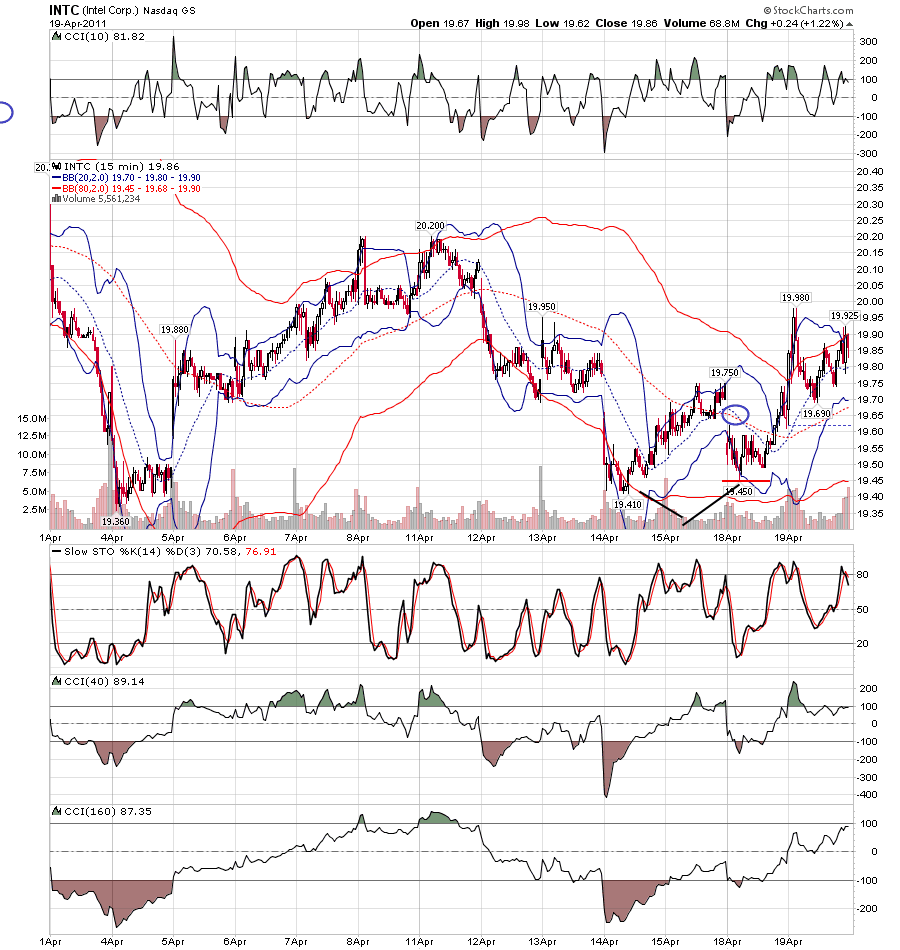
if you need examples look at your INTC, FSLR, GS charts...beautiful setups....
RO
roofer
Rep: 3,689
Posts: 3,574
the four pillars of geometric trading.... the line,frequency, sq rt, measurable move...we owe it to jim for showing us ALL! the sqrt functions.. i am deeply grateful... my mentor devoted his life to the gann because the sq9 is a sqrt...calculator...perhaps he would have been a fib master if he had been armed with jim's fib...again the SPX is clear to me... first support comes where the lines come together below price on the chart i posted before based on the frequency of the lines from 3 classically drawn medianline sets.
JI
jimkane
Rep: 3,058
Posts: 33,089
It was indeed awesome and clear. That ES ABCD after the Fed announcement set it all up, as mentioned in my post above, and the lines that didn't produce any reactions at all told the tale of a ride til close scenario. Given the S&P lines right in here, I would be shocked if this didn't bounce up tomorrow and head towards the next shorting spot. The move, though, through key areas indicates to me we are indeed likely in a 'wave 3' type situation now, and this is the acceleration phase. That's just one scenario, though, and I just look for setups. As roofer has pointed out, they can be quite clear. I strongly suspect, though, we will finish tomorrow far from this point. More likely up I suspect, and if down, perhaps in a nice mid-term climax. With that VIX barely able to get past 23, they'll still sell you puts for dirt cheap with no fear. And that doesn't mark a serious bottom of any kind to me. The extreme breadth only signals me to be ready for a bounce off an area.

RO
roofer
Rep: 3,689
Posts: 3,574
more
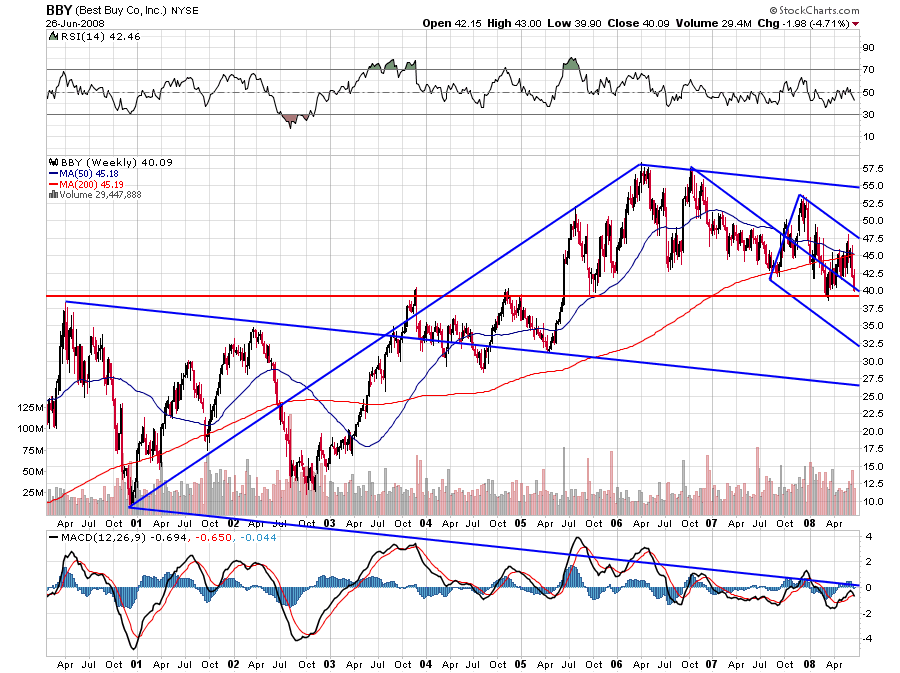
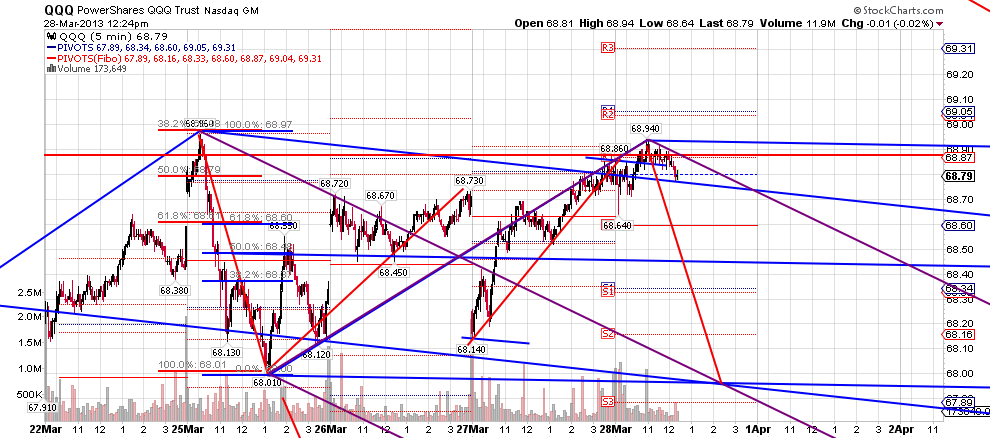
strictly based on the tools, i have a bet that bby will go bankrupt...
Click image for original size
Click image for original size
Click image for original size
Click image for original size
strictly based on the tools, i have a bet that bby will go bankrupt...
JI
jimkane
Rep: 3,058
Posts: 33,089
OK, get this, I'm totally serious. After the talking heads talked all day yesterday and this AM about how we are 'officially' in a bear market now, including even the more conservative and non-hype channel, the market then bounces up a little bit on that short-covering rally, and they immediately start saying 'No, wait, it's not a bear market now...'. If that wasn't bad enough, guess what I just heard. Yep, 'Is that it, is the bottom in now?' That was actually said with a straight face. I pretty much just watch these channels for the comedy relief, but this is ridiculous.
- Page(s):
- 45
- 46
- 47
- 48
- 49
- 50
- 51
- 52
- 53
- 54
- 55
- 56
- 57
- 58
- 59
- 60
- 61
- 62
- 63
- 64
- 65
- 66
- 67
- 68
- 69
- 70
- 71
- 72
- 73
- 74
- 75
- 76
- 77
- 78
- 79
- 80
- 81
- 82
- 83
- 84
- 85
- 86
- 87
- 88
- 89
- 90
- 91
- 92
- 93
- 94
- 95
JI
jimkane
Rep: 3,058
Posts: 33,089
I think the second chart is particularly telling. I agree with the conclusion, this market is nothing more than Euro-yen carry trade on, Euro-yen carry trade off. No balance, no participation, no depth, as I discussed in my last monthly commentary, just leverage/deleverage, risk on/risk off, and that's it. Skynet is totally sentient. How long, like in the movie, until the machines decide to vaporize the useless humans?
http://www.zerohedge.com/article/tale-two-decouplings
http://www.zerohedge.com/article/tale-two-decouplings