I thought I might try something different here, and see how it goes. It's quite difficult for me to post a lot to the various topics, especially with charts, since the method I use for posting charts is very cumbersome. Some charts can take me a half hour or more to put together. Since the charts I use for posting are not my 'working' charts, this work is duplicative.
I have various ideas and thoughts here and there about different things, and if I have a 'central clearing area' where I can just put out a sentence or two, pointing to something without doing the work, the members can do what assessment and analysis they want with the ideas, and post charts if they want, preferably to the respective areas they have for that topic. This way it would leave this topic more 'clean'. If you have a question or comment on what I was pointing out you could post that in here.
Let me know if you have any thoughts on this, or anything you think would be helpful/useful. Keep in mind I am not going to just tell you all my best setups in advance, especially if I plan to trade them, as that is not 'what I do' in here, or anywhere. I want to point out things that may need some work, and might go unnoticed otherwise, or are just of interest.
JI
jimkane
Rep: 3,058
Posts: 33,089
Yes, T, I commented it was arguably the best trading day I've seen in the MR. This whole week has been insane. I just can't get over it. I commented something like: 'I can't believe how they can move this thing like a trillion dollar hedge funny toying with a penny stock.' The $ movement is just incomprehensible. I sure hope they don't wreck the Russell when they move it...
JI
jimkane
Rep: 3,058
Posts: 33,089
Everyone sees that this flat is set up perfectly as a 'wave 2' for the end of the bear market rally, right? Assuming it is a bear market rally. And assuming it is over. If so, though, this would be a classic 'wave 2' here, and this monster reaction is then the start of 'wave 3'.
JI
jimkane
Rep: 3,058
Posts: 33,089
Well, that was the best week in the Russell (and the market in general) I think I have ever seen. Monster sized moves, and not a lot wasted on big gaps. I can only dream about what it would be like if it were like this all the time...
JI
jimkane
Rep: 3,058
Posts: 33,089
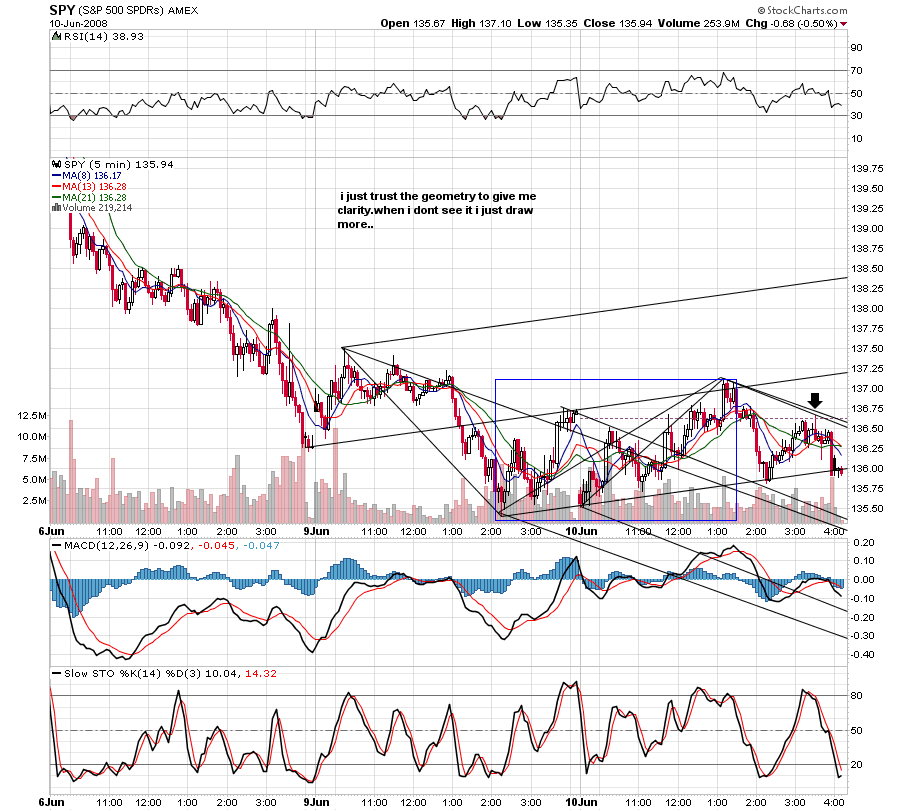
Did everyone see this came right off those smaller ABCD's? Sure looked bullish, that run into the close, eh? What a beautiful trap. Now we see on the 'retest' what happens at that 1350 area '50%' retracement every talking head on TV has been bragging about...
JI
jimkane
Rep: 3,058
Posts: 33,089
Here's a few interesting links, for those that like to go beyond just trading techniques and muse over the possible workings of the world we know:
Part I: http://www.star-telegram.com/ed_wallace/story/651928.html
Part II: http://www.star-telegram.com/ed_wallace/story/659081.html
http://articles.moneycentral.msn.com/Commentary/ByAuthor/BillFleckenstein.aspx
http://www.gata.org/node/6242
With the last link there is a lot more to be found of interest on that website beyond the one article I chose here.
JI
jimkane
Rep: 3,058
Posts: 33,089
I think we are at an area which bears close scrutiny. Can someone (M?) do a daily S&P chart (not in here, use an existing topic or create one)? Do an adjusted set using the high on 2/27/08, the low on 3/17/08, and 'lock' it on the 5/19/08 high. Another set, pointing to a spot a bit lower, can be done using the 2/1/08 high. For now, I want to look at the first set I mentioned, so only show that. Yes, there is a slew of work that can be done for this area, and some other areas, but by showing just this one set you can see the gist of what has me interested here.
Let's consider just a few factors as we sit at this juncture in the market. First, look at the extreme divergence of the INDU, with not only the S&P, but then the RUT and the NDX. RUT and NDX look great, strong, and ready to rocket up some more. The INDU looks ready for an imminent collapse, and the S&P doesn't look too far behind. Likely this is due to the heavy financial components, and possibly more rotation than actually moving money out of stocks. So, if the INDU and S&P were to move down, what would that imply as far as the Russell (look at the mid caps, too) and the Naz? And if this S&P area creates a bounce, what are the areas for the Russell and the Naz? The charts will tell you a lot.
Also, the '50%-ers' that were sure this would rocket up at the S&P 50% level (all the while not even acknowledging that the INDU was well under its 50% at the time) are now only talking about the Jan/March lows now, acting like a monster breach of the 50% they were talking about non-stop has no significance, and acting like they never even mentioned it, now fixated on the lows, like they are now the be all, end all. These characters never change. They just keep guessing until they are right once, like the proverbial stopped clock that is right twice a day, and then they say 'See, I told you'.
Next, the VIX is still very low. Look at previous sell-off spikes. The VIX can barely breach 23 here so far this week. Previous climaxes in this down move were in the 35-37 range. In the last bear we saw 55-60+, and I had heard the calculated value for the '87 crash was over 150. 23 to me says they will sell you puts right now for dirt cheap. They have almost zero fear, in my opinion. That doesn't mark even an intermediate-term bottom in my opinion. Maybe a small bounce, but not anything too substantial. On the other hand, the futures VIX spread has narrowed greatly, and that can imply a bounce coming. Just something I am watching.
Finally, the breadth measures are getting to the point that a little bounce may be needed to get it from getting too 'oversold'. This is not always useful information, though, because, as we all know, oversold can get way more oversold if the sellers are there. Just another apsect I am watching as we hit into a key area. The charts and the price action will dominate for me, as always, but I will be watching these other factors as things develop. If we start up tomorrow, though, you know what I'll be thinking.
JI
jimkane
Rep: 3,058
Posts: 33,089
Just as an aside, since the methodology is not about prediction, but about making decisions on whether a sufficient edge exists at selected areas or not, I wanted to mention that I have some other timing techniques in combination with the usual work, and they are showing me an area for a good-sized bounce (one where they say the bear is positively dead, like they did over and over in the last bear) in the Oct timeframe, give or take (this is not based on the bottom in Oct idea people talk about all the time, although that is an interesting coincidence). The INDU value would be around 11K, and the SP around 1200. Both these areas jump out using the usual techniques, but what is interesting is the time factor from an unrelated approach pointing to the same spot. Just something I am looking at, and wanted to throw out there.
RO
roofer
Rep: 3,689
Posts: 3,574
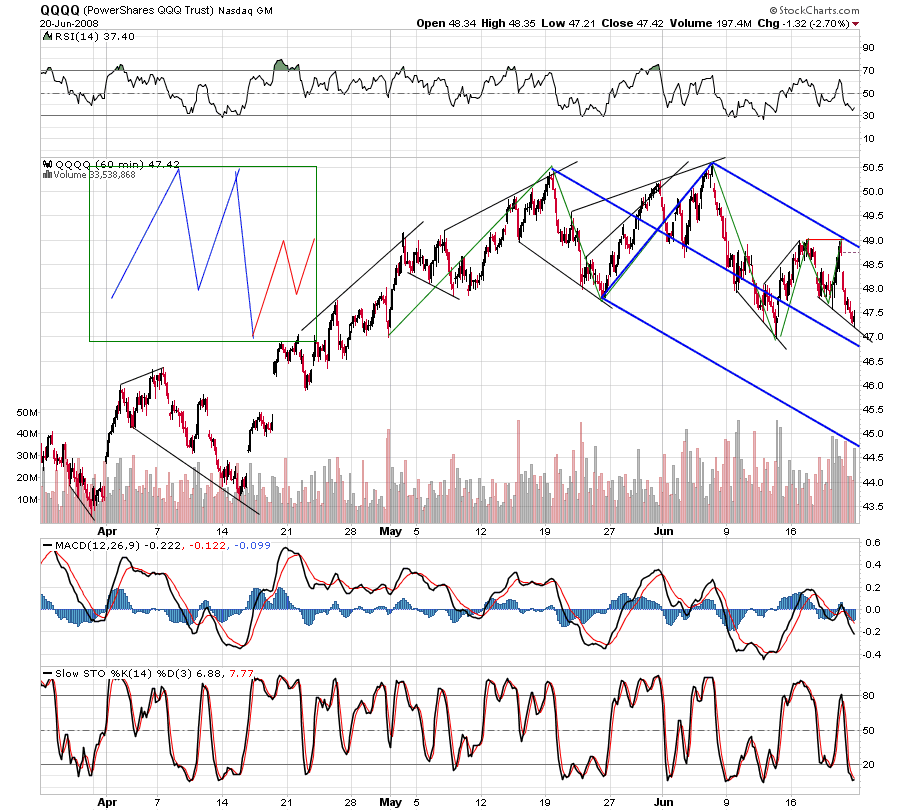
jim sometimes i worry that you think too much. that is my greatest weakness... with the setup on thursdays close, all i would hope you are wor
Click image for original size
Click image for original size
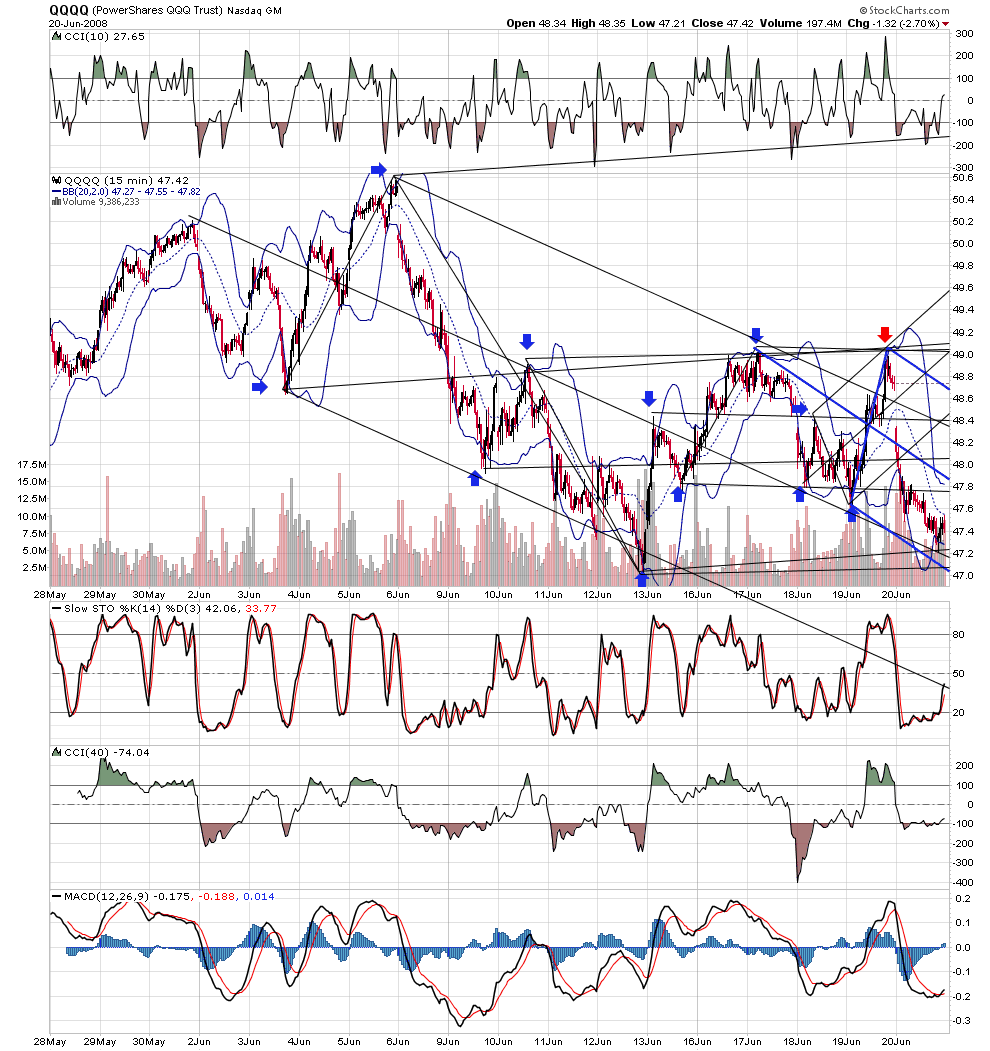
ried about is what you are going to do with all the money you made...just kidding... setup..- Page(s):
- 44
- 45
- 46
- 47
- 48
- 49
- 50
- 51
- 52
- 53
- 54
- 55
- 56
- 57
- 58
- 59
- 60
- 61
- 62
- 63
- 64
- 65
- 66
- 67
- 68
- 69
- 70
- 71
- 72
- 73
- 74
- 75
- 76
- 77
- 78
- 79
- 80
- 81
- 82
- 83
- 84
- 85
- 86
- 87
- 88
- 89
- 90
- 91
- 92
- 93
- 94
- 95
JI
jimkane
Rep: 3,058
Posts: 33,089
I think the second chart is particularly telling. I agree with the conclusion, this market is nothing more than Euro-yen carry trade on, Euro-yen carry trade off. No balance, no participation, no depth, as I discussed in my last monthly commentary, just leverage/deleverage, risk on/risk off, and that's it. Skynet is totally sentient. How long, like in the movie, until the machines decide to vaporize the useless humans?
http://www.zerohedge.com/article/tale-two-decouplings
http://www.zerohedge.com/article/tale-two-decouplings