I thought I might try something different here, and see how it goes. It's quite difficult for me to post a lot to the various topics, especially with charts, since the method I use for posting charts is very cumbersome. Some charts can take me a half hour or more to put together. Since the charts I use for posting are not my 'working' charts, this work is duplicative.
I have various ideas and thoughts here and there about different things, and if I have a 'central clearing area' where I can just put out a sentence or two, pointing to something without doing the work, the members can do what assessment and analysis they want with the ideas, and post charts if they want, preferably to the respective areas they have for that topic. This way it would leave this topic more 'clean'. If you have a question or comment on what I was pointing out you could post that in here.
Let me know if you have any thoughts on this, or anything you think would be helpful/useful. Keep in mind I am not going to just tell you all my best setups in advance, especially if I plan to trade them, as that is not 'what I do' in here, or anywhere. I want to point out things that may need some work, and might go unnoticed otherwise, or are just of interest.
MR
mreiserer
Rep: 110
Posts: 2,220
I think what's happening right now is just totally unbelievable, but it also paints a clear picture as to how the markets (and as such human behaviour) are really setup. I am no advocate for a bear market, a recession or for things to get bad, but none of this makes sense. I mean when will it end? Are they just going to keep sustaining an artifical bubble forever? Most people are already living in a virtual reality, so it wouldn't be far-fetched to take this further and further until the lines are so skewed that no one can tell the difference anymore. Every day I wake up I can only think that nothing is real....Is this a dream? Are we actually here, experiencing all this?
JI
jimkane
Rep: 3,058
Posts: 33,089
I actually have had similar thoughts, that our lives are getting surrealistic, and that I can no longer trust anything I see on face value. Very distressing.
JI
jimkane
Rep: 3,058
Posts: 33,089
Yes, that's another breakdown to new all-time lows in the dollar. Another all-time record for gold, and look at silver! Wheat's not moving too much though, only up about 135 at the high today, up about 30% (yes, you read that right, 30% in a commodity) in about three days, this, after running up, what, 400% in recent times? It's begun...
MR
mreiserer
Rep: 110
Posts: 2,220
Time to take that money out of the bank accounts and put it under the pillow.
Not that it matters when/if it becomes worthless, but I don't wanna be one of those knocking on my banks doors trying to take money out....at least it'll be under the pillow like worthless hay...
Sounds crazy? Maybe, but I just can't help that feeling right now.....
Boy, I hope I am wrong...
Not that it matters when/if it becomes worthless, but I don't wanna be one of those knocking on my banks doors trying to take money out....at least it'll be under the pillow like worthless hay...
Sounds crazy? Maybe, but I just can't help that feeling right now.....
Boy, I hope I am wrong...
JI
jimkane
Rep: 3,058
Posts: 33,089
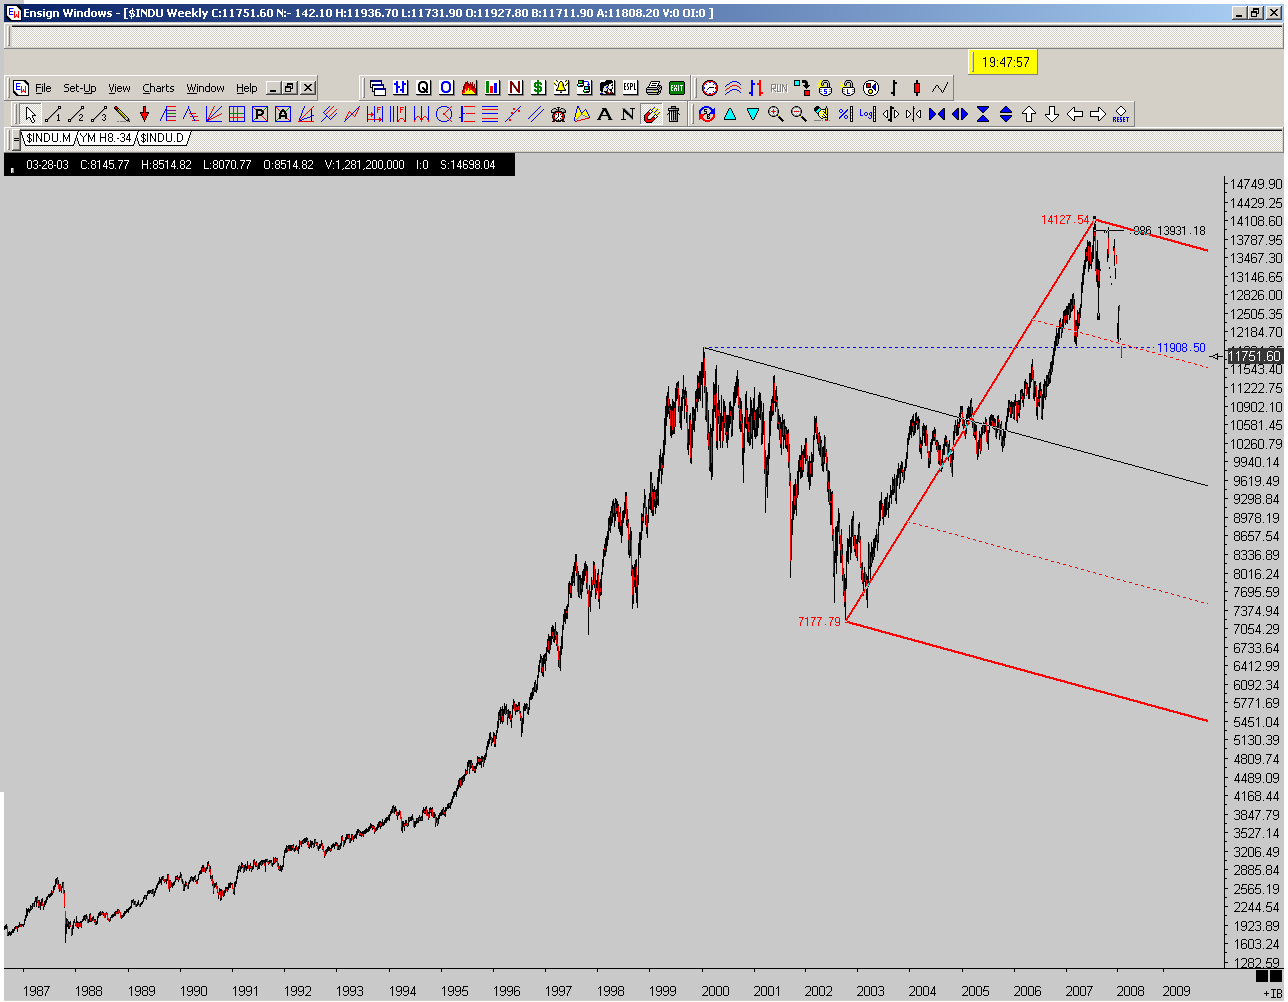
I'm surprised no one commented on this. Where did the INDU go to for the last bounce (went through a little, then bounced up strongly),and where is it right back at right now? Yes, the 2000 bubble bull market top. Not one single talking head, analyst, or post I read anywhere mentioned that we are right at that very line when the bounce started. Coming back down to the top of such a key peak is a very important point, and I didn't even see a mention in the Worden notes for Telechart, and that's just the kind of thing they usually point out. Curious, huh, not only where we sit now, but that no one pointed it out anywhere?
AL
albert
Rep: 99
Posts: 3,094
Very curious, indeed. Thanks for pointing that out. Here is a chart that I got for the $INDU weekly. Looking at the chart, I noticed the 1987 drop in the $INDU, & thought about those old days. Very sobering.
Good Trading,
Al Kamego
Good Trading,
Al Kamego
Click image for original size
JI
jimkane
Rep: 3,058
Posts: 33,089
Here's another curious thing. I have a slew of bullish ABCD's, mostly on 60-min charts, all coming together right now. I'm not very bullish at this point, but given the futures are up a bit (there's a lot of darkness before the light, though), I'm wondering if this may start a bounce. If not, then they may well be 'wave 3's'. Something to be aware of, for sure.
- Page(s):
- 34
- 35
- 36
- 37
- 38
- 39
- 40
- 41
- 42
- 43
- 44
- 45
- 46
- 47
- 48
- 49
- 50
- 51
- 52
- 53
- 54
- 55
- 56
- 57
- 58
- 59
- 60
- 61
- 62
- 63
- 64
- 65
- 66
- 67
- 68
- 69
- 70
- 71
- 72
- 73
- 74
- 75
- 76
- 77
- 78
- 79
- 80
- 81
- 82
- 83
- 84
- 85
- 86
- 87
- 88
- 89
- 90
- 91
- 92
- 93
- 94
- 95
JI
jimkane
Rep: 3,058
Posts: 33,089
I think the second chart is particularly telling. I agree with the conclusion, this market is nothing more than Euro-yen carry trade on, Euro-yen carry trade off. No balance, no participation, no depth, as I discussed in my last monthly commentary, just leverage/deleverage, risk on/risk off, and that's it. Skynet is totally sentient. How long, like in the movie, until the machines decide to vaporize the useless humans?
http://www.zerohedge.com/article/tale-two-decouplings
http://www.zerohedge.com/article/tale-two-decouplings