I thought I might try something different here, and see how it goes. It's quite difficult for me to post a lot to the various topics, especially with charts, since the method I use for posting charts is very cumbersome. Some charts can take me a half hour or more to put together. Since the charts I use for posting are not my 'working' charts, this work is duplicative.
I have various ideas and thoughts here and there about different things, and if I have a 'central clearing area' where I can just put out a sentence or two, pointing to something without doing the work, the members can do what assessment and analysis they want with the ideas, and post charts if they want, preferably to the respective areas they have for that topic. This way it would leave this topic more 'clean'. If you have a question or comment on what I was pointing out you could post that in here.
Let me know if you have any thoughts on this, or anything you think would be helpful/useful. Keep in mind I am not going to just tell you all my best setups in advance, especially if I plan to trade them, as that is not 'what I do' in here, or anywhere. I want to point out things that may need some work, and might go unnoticed otherwise, or are just of interest.
RO
roofer
Rep: 3,689
Posts: 3,574
when i go elsewhere i can not show the bulk of jim's work... when i am here i can not show joed's work or the work of other traders that have asked to not even be mentioned..... basically jim has only scratched the surface here of what he uses in his personal trading, especially in terms of what he uses in lines.... i would hazard a guess that i am using a lot of the same lines....
JI
jimkane
Rep: 3,058
Posts: 33,089
Just look at how gold and oil are getting 'monetized'. People don't realize some of the things that excess liquidity actually does, in my opinion.
JI
jimkane
Rep: 3,058
Posts: 33,089
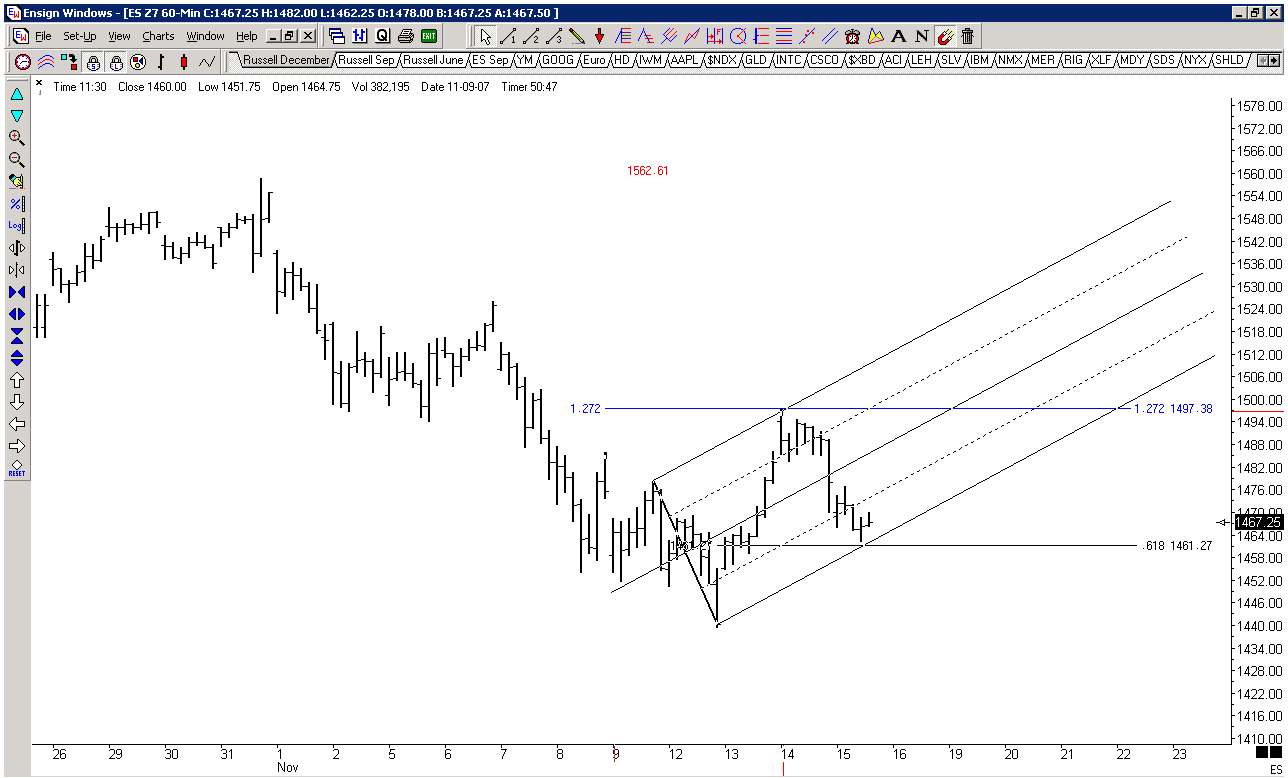
Look at all the ABCD's that are completing now, at key lines, across the board. If these are not CD legs, but 'wave 3's', then watch out. This will be quite interesting.
JI
jimkane
Rep: 3,058
Posts: 33,089
Can they hold this? Sure looks like they want to shoot for 'point D'...
JI
jimkane
Rep: 3,058
Posts: 33,089
So, is the bounce over? How about some charts (not in here, start a new thread or use an existing one) showing what is here, and what is the next stop on the way up.
JI
jimkane
Rep: 3,058
Posts: 33,089
OK, INDU and S&P have 15/60-min sets pointing up right in here. If this bounce is to continue, this is the spot I want to watch closely. It's 'clue time'.
JI
jimkane
Rep: 3,058
Posts: 33,089
Yes, and it's pretty much the same on the INDU, S&P, and similar in the NAZ comp. It's acting like it wants to go lower, to the areas we discussed (did anyone show this work?), but this is the best 'do or die' spot I have to watch for clues.
MR
mreiserer
Rep: 110
Posts: 2,220
The thing that I have with this spot, like you say, I am not finding a likable premise where I would want to go long here.
If this were a wave 2 it just doesn't look corrective.
If this were a wave 2 it just doesn't look corrective.
- Page(s):
- 27
- 28
- 29
- 30
- 31
- 32
- 33
- 34
- 35
- 36
- 37
- 38
- 39
- 40
- 41
- 42
- 43
- 44
- 45
- 46
- 47
- 48
- 49
- 50
- 51
- 52
- 53
- 54
- 55
- 56
- 57
- 58
- 59
- 60
- 61
- 62
- 63
- 64
- 65
- 66
- 67
- 68
- 69
- 70
- 71
- 72
- 73
- 74
- 75
- 76
- 77
- 78
- 79
- 80
- 81
- 82
- 83
- 84
- 85
- 86
- 87
- 88
- 89
- 90
- 91
- 92
- 93
- 94
- 95
JI
jimkane
Rep: 3,058
Posts: 33,089
I think the second chart is particularly telling. I agree with the conclusion, this market is nothing more than Euro-yen carry trade on, Euro-yen carry trade off. No balance, no participation, no depth, as I discussed in my last monthly commentary, just leverage/deleverage, risk on/risk off, and that's it. Skynet is totally sentient. How long, like in the movie, until the machines decide to vaporize the useless humans?
http://www.zerohedge.com/article/tale-two-decouplings
http://www.zerohedge.com/article/tale-two-decouplings