Day Trading with TTT and other tools
Welcome to this new thread, where we can share trading ideas and our thoughts on the Taylor Trading Technique.
Anyone with questions on TTT, this is the place.
Anyone with questions on TTT, this is the place.
Rich and Laurent,
Thank you both for your replies. With TTT being fulfilled I was becoming lost and the market now looks a little lost. The only think I had left was to wait for a perfect pattern and follow with close stops.
Ya'll have a great day,
Thank you both for your replies. With TTT being fulfilled I was becoming lost and the market now looks a little lost. The only think I had left was to wait for a perfect pattern and follow with close stops.
Ya'll have a great day,
quote:
Originally posted by Larry22
My second trade as I didn't had the chance to sell earlier.
I will explain later on why I bought in this area, of course we were close to the TTT expected low and we are in a buy day but there is more to that that convinced me that it was a good place to buy.
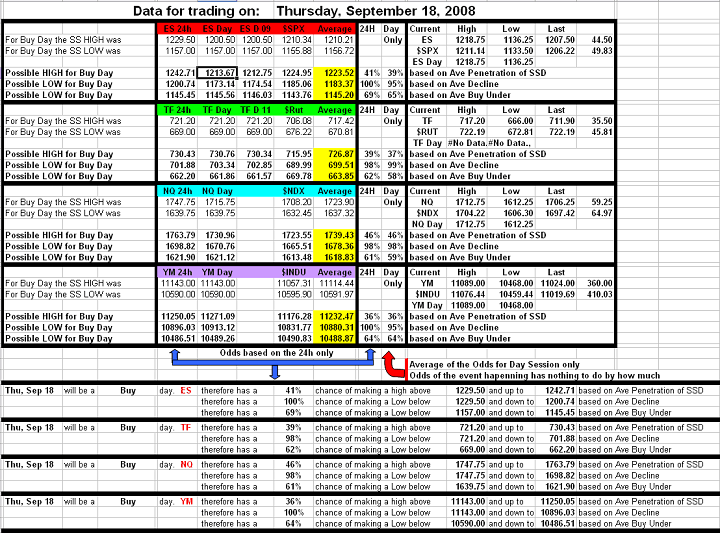
Given the fact that we had 69% chances of testing the low or going lower I was not surprised to see the market making new lows to reach and go a bit lower then the TTT expected low as I had some Fib targets around 1138 and 34 so when the market went in this zone and stopped his decline at this area I decided it was time to buy as we may have completed the wave (3C) (green label) since the 1.62% of wave (1A) and (2B) had been reached. The chart posted is a 60 min as this way you can have a better view of the entire decline.
Laurent
Click image for original size
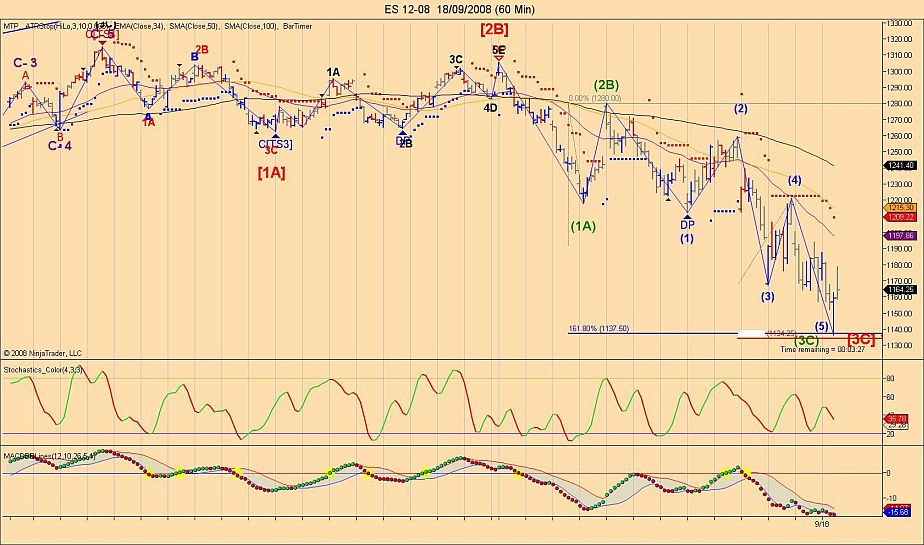
Today was a Buy Day. We needed a decline and we did. We did have a 69% chance of making a lower low and we did that too. As you can see lately we are getting more then double the average daily spread (range) then usual. With that we are hitting and surpassing both the projected highs and lows.
Click image for original size
I need to say that Rich’s TTT report helps me to take a lot of guess work out of my trading. It is a very useful tool.
Thanks to Laurent for introducing me to this method, and Rich’s valuable daily report. I am new to the Elliott Wave. I can’t imagine the level I can elevate to in trading if I can count the waves just half as good as the guys here.
Cheers all...
Thanks to Laurent for introducing me to this method, and Rich’s valuable daily report. I am new to the Elliott Wave. I can’t imagine the level I can elevate to in trading if I can count the waves just half as good as the guys here.
Cheers all...
Anyone else using MTP thinking that that 1251.25 print may be the HOD?
Looking at the 24 hour 15 minute chart makes me think it a good place to get short with a stop loss above that high.
Of course, in this new era of government market manipulation where the powers that be are intent on declaring it law that markets may only go up, being short may be the same thing as being dumb.
Good Luck today!
ddaytrader
quote:
Originally posted by ddaytrader
Anyone else using MTP thinking that that 1251.25 print may be the HOD?
Looking at the 24 hour 15 minute chart makes me think it a good place to get short with a stop loss above that high.
Of course, in this new era of government market manipulation where the powers that be are intent on declaring it law that markets may only go up, being short may be the same thing as being dumb.
Good Luck today!
ddaytrader
That would be the contrarian point of view!
I kinda think the market is like an ADD kid just taken off his medication. Liable to run wild and in many directions. The only time you know what he is going to do is after he runs into a wall and falls down for a short time. That's about it
If you have a high confidence pattern, sure, that's my strategy for now, 'cause it's crazy out here
Good luck,
PS Please don't think I'm being mean or disrespectful to anyone or their children, my mind just comes up with wierd analagies, and it's a poor attempt at humor
quote:
Originally posted by ddaytrader
Anyone else using MTP thinking that that 1251.25 print may be the HOD?
Looking at the 24 hour 15 minute chart makes me think it a good place to get short with a stop loss above that high.
Of course, in this new era of government market manipulation where the powers that be are intent on declaring it law that markets may only go up, being short may be the same thing as being dumb.
Good Luck today!
ddaytrader
I had 1255 as possible top as this was a Fib cluster and it seem that this could be the top indeed as it has reached that price and already dropped a few points from the 1257.75 high so if this resistance is taken out and we go over 1259 then we can easily go 10 more points.
So yes ddaytrader this seems to be the place to sell for the moment as we sure do need some kind of pullback but the question is when will it happen.
Laurent
Considering the special circumstances happening in the market at this moment I have decided to share my longer time charts (daily and weekly) to every current subscribers of Richard's TTT book and to any new one who will subscribe in the next 7 days.
Laurent
Laurent
Hi Laurent,
Thanks ... how & when the charts will be distributed to TTT subscribers?
Thanks ... how & when the charts will be distributed to TTT subscribers?
Is this what happens to the markets when the goverment runs around the house with scissors?
- Page(s):
- 33
- 34
- 35
- 36
- 37
- 38
- 39
- 40
- 41
- 42
- 43
- 44
- 45
- 46
- 47
- 48
- 49
- 50
- 51
- 52
- 53
- 54
- 55
- 56
- 57
- 58
- 59
- 60
- 61
- 62
- 63
- 64
- 65
- 66
- 67
- 68
- 69
- 70
- 71
- 72
- 73
- 74
- 75
- 76
- 77
- 78
- 79
- 80
- 81
- 82
- 83
- 84
- 85
- 86
- 87
- 88
- 89
- 90
- 91
- 92
- 93
- 94
- 95
- 96
- 97
- 98
- 99
- 100
- 101
- 102
- 103
- 104
- 105
- 106
- 107
- 108
- 109
- 110
- 111
- 112
- 113
- 114
- 115
- 116
- 117
- 118
- 119
- 120
- 121
- 122
- 123
- 124
- 125
- 126
- 127
- 128
- 129
- 130
- 131
- 132
- 133
- 134
- 135
- 136
- 137
- 138
- 139
- 140
- 141
- 142
- 143
- 144
- 145
- 146
- 147
- 148
- 149
- 150
- 151
- 152
I hope all you TTT traders had a good 2014 and I wish you all a better 2015
Richard
Richard
Emini Day Trading /
Daily Notes /
Forecast /
Economic Events /
Search /
Terms and Conditions /
Disclaimer /
Books /
Online Books /
Site Map /
Contact /
Privacy Policy /
Links /
About /
Day Trading Forum /
Investment Calculators /
Pivot Point Calculator /
Market Profile Generator /
Fibonacci Calculator /
Mailing List /
Advertise Here /
Articles /
Financial Terms /
Brokers /
Software /
Holidays /
Stock Split Calendar /
Mortgage Calculator /
Donate
Copyright © 2004-2023, MyPivots. All rights reserved.
Copyright © 2004-2023, MyPivots. All rights reserved.