Day Trading with TTT and other tools
Welcome to this new thread, where we can share trading ideas and our thoughts on the Taylor Trading Technique.
Anyone with questions on TTT, this is the place.
Anyone with questions on TTT, this is the place.
quote:
Originally posted by Richbois
quote:
Originally posted by jands
quote:
Originally posted by Richbois
In Last night’s report I commented that “Tomorrow will be the Sell day, the confusing day. Having rallied from the lows of the day we made most of the average Rally. I would expect a continuation rally and maybe a test of today's highs”.
We tested the Day's high during the overnight session, and failed to take it out. We also had a 57% chance of making a lower low. So far that was barely achieved when we tested yesterday’s lows.
Rich,
We have a BUY DAY Violation in the ES, shouldn't we now expect a target at the Avg Buy Day Low Violation?
Jim
Normally yes but so far the violation was very shallow so it is hard to say.
ES having failed to get above 1255 made a 3rd attempt for lower and now both the Russell and ES are at or close to the TTT projected levels
The NQ and YM are in DP areas plus Buy Vio Avg and the YM is at 61.8%
Nothing seems to be reversing them. Just slowing them down.
(of course no sooner than I post this, the markets will zoom away!)
Nothing seems to be reversing them. Just slowing them down.
(of course no sooner than I post this, the markets will zoom away!)
Sorry for the delay but trading and posting is very hard to do when you want to include a pic. I already sold my last lot for a lawzy 4 points as this market is very weak and time goes by. I have to go to the grocery store to get some food for supper before my wife kills me.
Click image for original size
Well I got out in time we have now reached my second cluster area but I won't trade as I have to go away. The market is very weak so far as we didn't get much bounces of the first cluster then went at the TT low where I bought and now we may finally have a rally from this second cluster zone as we are still near the TTT expected low.
Today was a Sell day. We tested Yesterday's highs during the overnight session , and failed to take it out. We also had a 57% chance of making a lower low. This was achieve and it took 3 tests to finally get through and ES and ER2/AB made it to the TTT projected lows. These projected lows and highs do offer resistance and support. As we saw 1233 area offered support and even a bounce from there only to be taken out later.
Attached is a copy of the excel report sent last night updated on the right with today's actual numbers.
Tomorrow is the SellShort day and we have 84-86% chance of getting above 1246.75. Being still in a bear market, and close to the July lows,lets see if we succeed getting a positive 3 day rally.
Attached is a copy of the excel report sent last night updated on the right with today's actual numbers.
Tomorrow is the SellShort day and we have 84-86% chance of getting above 1246.75. Being still in a bear market, and close to the July lows,lets see if we succeed getting a positive 3 day rally.
Click image for original size
Rich - Being a sell short day, I sold YM and rode it down 95 pts as one of my reversal signals kicked in. However I went long on ES (as per another reversal signal) at 1235.25 and got stopped out for a 3.5 pt loss.
In hindsight, the top was the top and what I thought a bottom wasn't a bottom.
What significance did the buy low violation have today, particularly regarding the 1233 area?
TIA
Marc
In hindsight, the top was the top and what I thought a bottom wasn't a bottom.
What significance did the buy low violation have today, particularly regarding the 1233 area?
TIA
Marc
quote:
Originally posted by neath
Rich - Being a sell short day, I sold YM and rode it down 95 pts as one of my reversal signals kicked in. However I went long on ES (as per another reversal signal) at 1235.25 and got stopped out for a 3.5 pt loss.
In hindsight, the top was the top and what I thought a bottom wasn't a bottom.
What significance did the buy low violation have today, particularly regarding the 1233 area?
TIA
Marc
According to my count today was a Sell day. You have a SS day, either way having failed to take out the high going short was the way to go. On ES as you can see from the picture on my previous post, we had a projected low to 1233.25-50. These numbers are derived from an average Buy day violation and will often offer support. We did get support for a while but it finally gave up.
Based on the statistics in my report we have a high percentage of having positive 3 Day rallies, which is calculated from the Buy day low to the SS day high. Therefore anytime we, on a Sell day get a violation of the Buy day, and specialy when we close below the Buy day low, we realy have good odds of getting back above that low.
However nothing is certain with the markets as we saw on the last cycle, but the odds are in your favor that we will get above 1246.75 in both the 24 hour and the day session tomorrow.
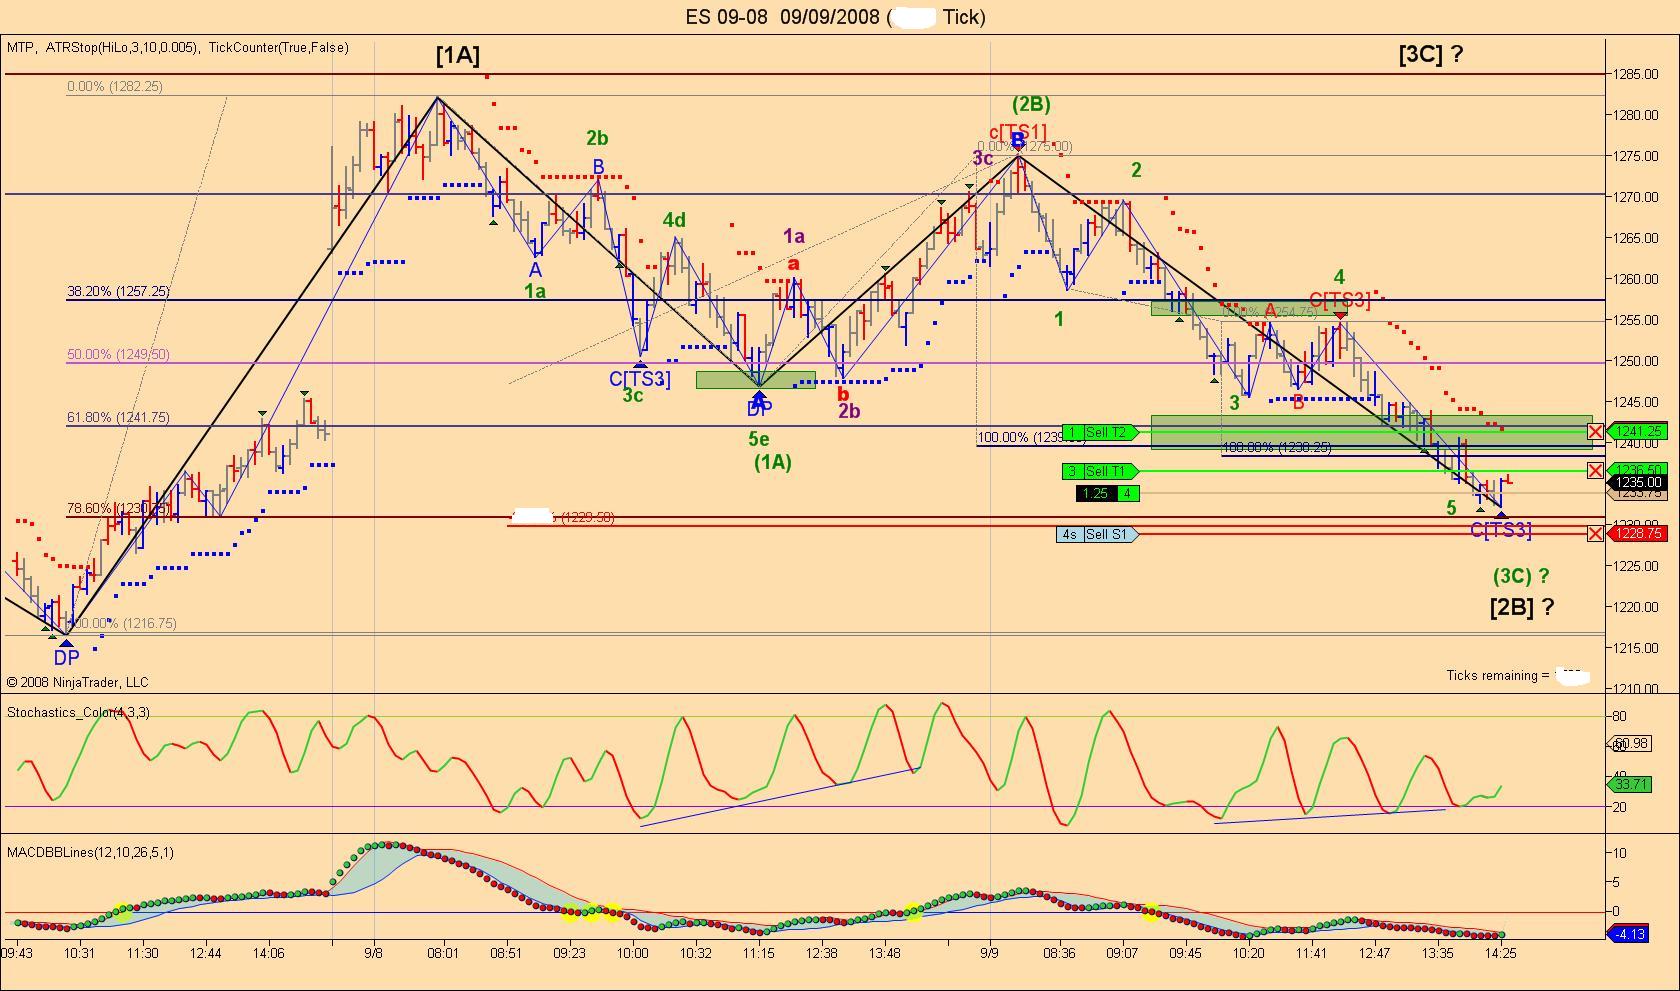
To make a follow up on Last night Market Review on the ES I will now post the 15 min charts updated but this time based on the 24 hour as we have now achieved what I was talking about.
We almost went to the 1.62% of wave (1A) and we have now a 5 waves pattern in the (3C) leg, so from this pattern we should expect some kind of a rally today. If this low is taken then it won't look too good for the bulls as the pressure will change to the downside.
We almost went to the 1.62% of wave (1A) and we have now a 5 waves pattern in the (3C) leg, so from this pattern we should expect some kind of a rally today. If this low is taken then it won't look too good for the bulls as the pressure will change to the downside.
Click image for original size
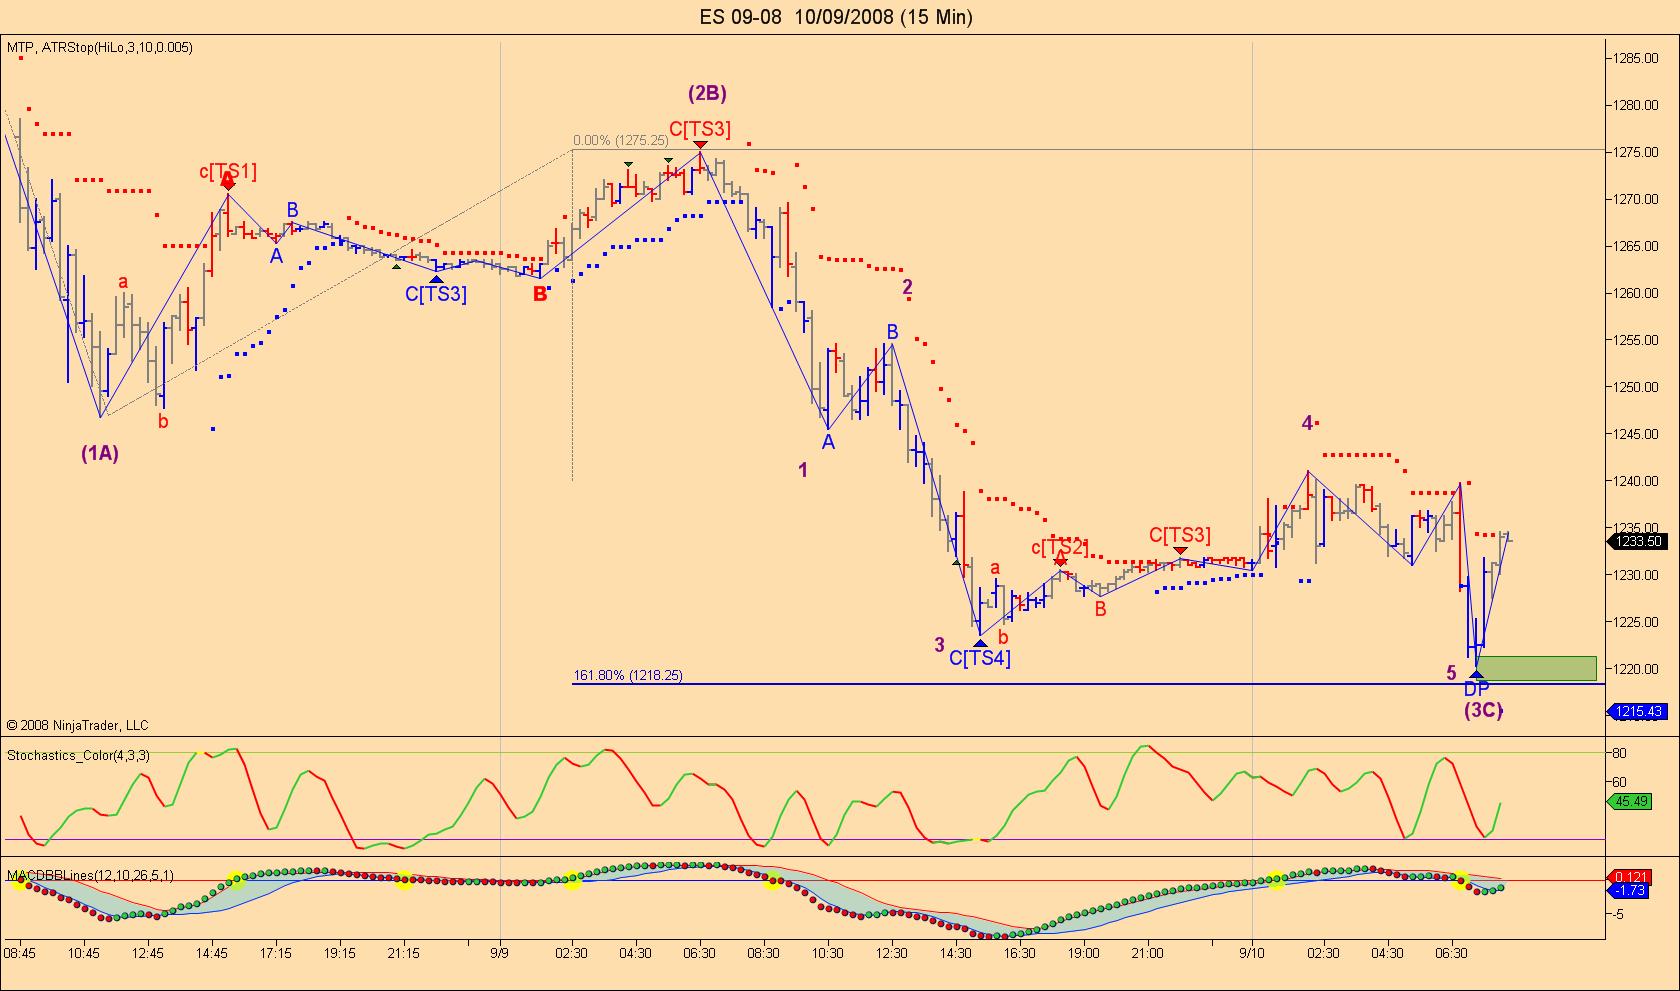
I forgot to mention that this low could be retested during the day session.
We now have a new low on the day session and a retest of the low on the 24 hr session.
Technically this should be then end of the down move as we have now 5 waves down (red label) in the 3C leg(green label.
We need a reversal on this 15 min chart to confirm this. I will post a pic later on.
Technically this should be then end of the down move as we have now 5 waves down (red label) in the 3C leg(green label.
We need a reversal on this 15 min chart to confirm this. I will post a pic later on.
- Page(s):
- 18
- 19
- 20
- 21
- 22
- 23
- 24
- 25
- 26
- 27
- 28
- 29
- 30
- 31
- 32
- 33
- 34
- 35
- 36
- 37
- 38
- 39
- 40
- 41
- 42
- 43
- 44
- 45
- 46
- 47
- 48
- 49
- 50
- 51
- 52
- 53
- 54
- 55
- 56
- 57
- 58
- 59
- 60
- 61
- 62
- 63
- 64
- 65
- 66
- 67
- 68
- 69
- 70
- 71
- 72
- 73
- 74
- 75
- 76
- 77
- 78
- 79
- 80
- 81
- 82
- 83
- 84
- 85
- 86
- 87
- 88
- 89
- 90
- 91
- 92
- 93
- 94
- 95
- 96
- 97
- 98
- 99
- 100
- 101
- 102
- 103
- 104
- 105
- 106
- 107
- 108
- 109
- 110
- 111
- 112
- 113
- 114
- 115
- 116
- 117
- 118
- 119
- 120
- 121
- 122
- 123
- 124
- 125
- 126
- 127
- 128
- 129
- 130
- 131
- 132
- 133
- 134
- 135
- 136
- 137
- 138
- 139
- 140
- 141
- 142
- 143
- 144
- 145
- 146
- 147
- 148
- 149
- 150
- 151
- 152
I hope all you TTT traders had a good 2014 and I wish you all a better 2015
Richard
Richard
Emini Day Trading /
Daily Notes /
Forecast /
Economic Events /
Search /
Terms and Conditions /
Disclaimer /
Books /
Online Books /
Site Map /
Contact /
Privacy Policy /
Links /
About /
Day Trading Forum /
Investment Calculators /
Pivot Point Calculator /
Market Profile Generator /
Fibonacci Calculator /
Mailing List /
Advertise Here /
Articles /
Financial Terms /
Brokers /
Software /
Holidays /
Stock Split Calendar /
Mortgage Calculator /
Donate
Copyright © 2004-2023, MyPivots. All rights reserved.
Copyright © 2004-2023, MyPivots. All rights reserved.