Day Trading with TTT and other tools
Welcome to this new thread, where we can share trading ideas and our thoughts on the Taylor Trading Technique.
Anyone with questions on TTT, this is the place.
Anyone with questions on TTT, this is the place.
- Page(s):
- 1
- 2
- 3
- 4
- 5
- 6
- 7
- 8
- 9
- 10
- 11
- 12
- 13
- 14
- 15
- 16
- 17
- 18
- 19
- 20
- 21
- 22
- 23
- 24
- 25
- 26
- 27
- 28
- 29
- 30
- 31
- 32
- 33
- 34
- 35
- 36
- 37
- 38
- 39
- 40
- 41
- 42
- 43
- 44
- 45
- 46
- 47
- 48
- 49
- 50
- 51
- 52
- 53
- 54
- 55
- 56
- 57
- 58
- 59
- 60
- 61
- 62
- 63
- 64
- 65
- 66
- 67
- 68
- 69
- 70
- 71
- 72
- 73
- 74
- 75
- 76
- 77
- 78
- 79
- 80
- 81
- 82
- 83
- 84
- 85
- 86
- 87
- 88
- 89
- 90
- 91
- 92
- 93
- 94
- 95
- 96
- 97
- 98
- 99
- 100
- 101
- 102
- 103
- 104
- 105
- 106
- 107
- 108
- 109
- 110
- 111
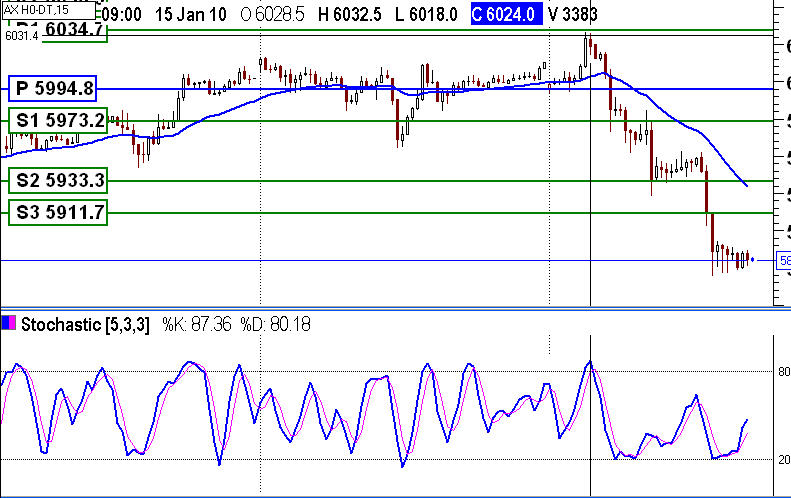
Another classic SS Day, Dax some 150pts down Ftse nearly 100.
ESmini, right of the first bar of the day.
Richbois, plotted Stoch on the 15min chart, with 5,3,3 setting, although I am not particularly a fan of maths indicator, it does appear to have some value in determining probable entry and exit.
ESmini, right of the first bar of the day.
Richbois, plotted Stoch on the 15min chart, with 5,3,3 setting, although I am not particularly a fan of maths indicator, it does appear to have some value in determining probable entry and exit.
Richbois, wonder if your settings look like this
Click image for original size
Is ESmini on a SELL DAY in which case price action would indicate BV long,
or due to holiday yesterday, does it turn out to be BUY DAY?
or due to holiday yesterday, does it turn out to be BUY DAY?
Originally posted by rigel
Thanks Richbois, am curious about TF, the exchange is ICE I believe now and a point equals $100
1. Do you find it liquid enough to trade? and do you encounter slippages.?
2. May I inquire as to which trading platform you use to trade this instrument.
3. Finally would very much appreciate a chart of yesterday's price action on TF.
Wow I didnt receive notifications that these posts were going on and was busy somissed all the action here
Sorry Rigel it will be hard to post old charts now.
Yes TF is on ICE and liquidity is good during day session and maybe 1 hour before open.
Other times is riskier. I rarely get slippage more than 1 tick but could be worst during news.
I deal with Infinity broker and I use their trading platform to place trades but I use Esignal data for charting in Esignal and NinjaTrader
Again sorry I see many posts but it will be hard to answer all off them as they are old by now and I would hate to play Monday morning quarterback.
as to the stochastic I use it for OverSold and OverBought indication and for divergence.
I beleive that Mr Lane the creator of the indicator also prefer the divergence use of it and not any crossing of lines.
That is why you will notice that on most of my charts there is only 1 line D% not to get influenced by the crossing signals. Tried those before and lost enough trying to use the crossing signals.
So far today was a text book TTT Buy day. ES TF and NQ opened and tested the Previous Day session high and failed to take them out and therefore reversed. We knew this was a Buy day and that we needed a decline so any excuse to short was good. If you missed the entry at the open we were given a second chance at 10.06 EST after a nice ABC up pattern. TF then dropped 14 points without touching the walls on the way down.
All 3 instruments stoped dead in their tracks when they reached the average TTT levels of 1118.50, 627.6 and 1848.59 respectively
As I am writing this it took 35-40 minutes for ES and NQ to manage to go lower. At this point who cares money is in the bank and day is done.
All 3 instruments stoped dead in their tracks when they reached the average TTT levels of 1118.50, 627.6 and 1848.59 respectively
As I am writing this it took 35-40 minutes for ES and NQ to manage to go lower. At this point who cares money is in the bank and day is done.
Hi Rich, good to see you back,
1. Regarding TF, it is encouraging to learn that the liquidity is enough so as not to encounter intolerable slippage, 1 tick is not bad at all, presume that would be $10,
do the TTT levels work well on that market in your experience and do you trade off 15min charts.
2. As for Stochastics, I presume you are using 5,3,3 setting, do you keep that setting across other timeframes besides 15min ie. 5min, 3min etc.
3. I make today as a BUY day, decline was expected, infact on the daily chart, uptrend was broken a few days back
ES has plummetted to the projected low of 1117,
wonder what are your readings.
Originally posted by rigel
Hi Rich, good to see you back,
1. Regarding TF, it is encouraging to learn that the liquidity is enough so as not to encounter intolerable slippage, 1 tick is not bad at all, presume that would be $10,
do the TTT levels work well on that market in your experience and do you trade off 15min charts.
2. As for Stochastics, I presume you are using 5,3,3 setting, do you keep that setting across other timeframes besides 15min ie. 5min, 3min etc.
3. I make today as a BUY day, decline was expected, infact on the daily chart, uptrend was broken a few days back
ES has plummetted to the projected low of 1117,
wonder what are your readings.
Yes TTT levels are working as well on TF as any other
I do look at the 15 min chart but only to see the bigger short term picture.
Yes I do use 5-3-3 on all min charts
I use 1 and 3 min charts also 1 min more for entry
as far as longer term Es broke the 1126 area and TF broke the 630 today so if we close below these levels that would be bad for the bulls. You can see from day charts that these level had held 5-6 times so they were critical in my opinion
Thks,
1080-1110 is a big support zone, if that breaks, then it could be all the way down to Nov. lows.
1080-1110 is a big support zone, if that breaks, then it could be all the way down to Nov. lows.
Originally posted by rigel
Thks,
1080-1110 is a big support zone, if that breaks, then it could be all the way down to Nov. lows.
yes to start then March lows
- Page(s):
- 113
- 114
- 115
- 116
- 117
- 118
- 119
- 120
- 121
- 122
- 123
- 124
- 125
- 126
- 127
- 128
- 129
- 130
- 131
- 132
- 133
- 134
- 135
- 136
- 137
- 138
- 139
- 140
- 141
- 142
- 143
- 144
- 145
- 146
- 147
- 148
- 149
- 150
- 151
- 152
I hope all you TTT traders had a good 2014 and I wish you all a better 2015
Richard
Richard
Emini Day Trading /
Daily Notes /
Forecast /
Economic Events /
Search /
Terms and Conditions /
Disclaimer /
Books /
Online Books /
Site Map /
Contact /
Privacy Policy /
Links /
About /
Day Trading Forum /
Investment Calculators /
Pivot Point Calculator /
Market Profile Generator /
Fibonacci Calculator /
Mailing List /
Advertise Here /
Articles /
Financial Terms /
Brokers /
Software /
Holidays /
Stock Split Calendar /
Mortgage Calculator /
Donate
Copyright © 2004-2023, MyPivots. All rights reserved.
Copyright © 2004-2023, MyPivots. All rights reserved.