Day Trading with TTT and other tools
Welcome to this new thread, where we can share trading ideas and our thoughts on the Taylor Trading Technique.
Anyone with questions on TTT, this is the place.
Anyone with questions on TTT, this is the place.
- Page(s):
- 1
- 2
- 3
- 4
- 5
- 6
- 7
- 8
- 9
- 10
- 11
- 12
- 13
- 14
- 15
- 16
- 17
- 18
- 19
- 20
- 21
- 22
- 23
- 24
- 25
- 26
- 27
- 28
- 29
- 30
- 31
- 32
- 33
- 34
- 35
quote:
Originally posted by gio5959
of course you know that nq dp was at rich's low
and rich's ttt nq low was there since yesterday's email
nothing beats pre-planning, eh
g
Wow didn't even looked at that NQ TTT expected low as I was too concentrated with the TF and ES. I knew I was missing something here.
Thanks gio for reminding me that.
Wow didn't even looked at that NQ TTT expected low as I was too concentrated with the TF and ES. I knew I was missing something here.
Thanks gio for reminding me that.
the thanks go to you and all the other great posters on this forum that give excellent advise
bruce is one of my other favorites
g
Hi All
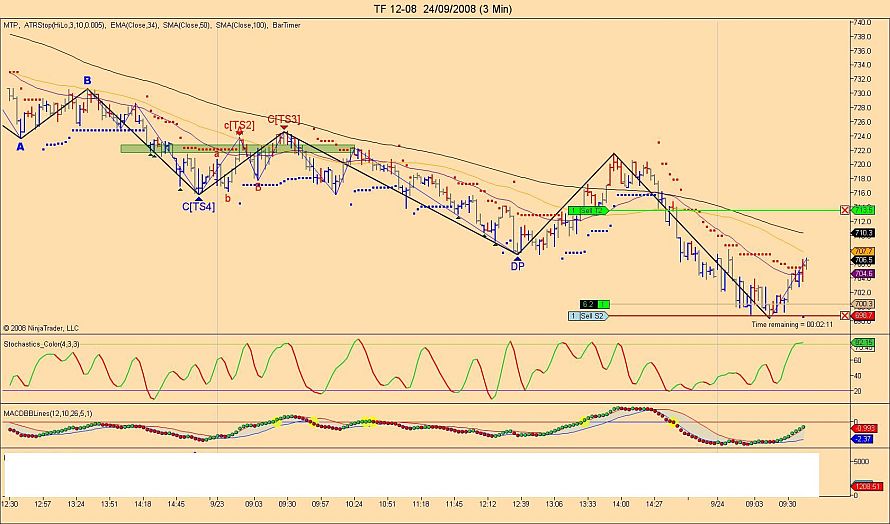
Today was a Sell day and although I though it would be not so confusing, but it held to its name and we had wide swings up and down. All except NQ made lower lows and TF bounced right on the projected lows.
Today was a Sell day and although I though it would be not so confusing, but it held to its name and we had wide swings up and down. All except NQ made lower lows and TF bounced right on the projected lows.
Click image for original size
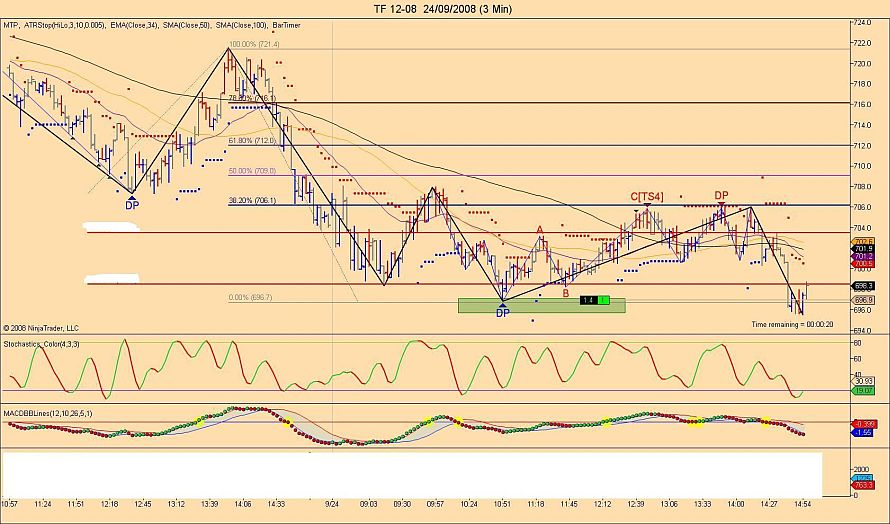
Based on the TTT book and a mix of EW and Fib clusters I was able to buy a few times the TF contract even near the end when we hit the TTT expected low at 696.
I will just post 2 of my trades as I had too many today.
I forgot to mention I made close to 8.3 points on the first trade (2 lots) and an average of 3 points on 2 lot as I had to exit before the end.
P.S I always buy 2 lots and exit the first one at 1.3 point from my entry price.
I will just post 2 of my trades as I had too many today.
I forgot to mention I made close to 8.3 points on the first trade (2 lots) and an average of 3 points on 2 lot as I had to exit before the end.
P.S I always buy 2 lots and exit the first one at 1.3 point from my entry price.
Click image for original size
Click image for original size
Hi Laurent,
I'am new user of TTT, and new to this board. I'd like to ask how you calculate Fib clusters that are mentioned almost in every of your posts? Also this hidden indicator at the bottom, does it have big impact to your decision making? Thanks.
I'am new user of TTT, and new to this board. I'd like to ask how you calculate Fib clusters that are mentioned almost in every of your posts? Also this hidden indicator at the bottom, does it have big impact to your decision making? Thanks.
quote:
Originally posted by ddkk
Hi Laurent,
I'am new user of TTT, and new to this board. I'd like to ask how you calculate Fib clusters that are mentioned almost in every of your posts? Also this hidden indicator at the bottom, does it have big impact to your decision making? Thanks.
Hi ddkk, if you have read some of my posts in the market reviews section you would have seen these as the last NQ chart that I posted had one on it. For your second question well I think I have shown a lot of things that I use but I feel that I don't have to show everything as I have made a lot of research to find them.
Regards
Laurent
Laurent,
thank you,will check them. Sorry for the question about "indicator", I didn't mean to disclose it, just wanted to know how much you rely on something else.
Regards,
dk
thank you,will check them. Sorry for the question about "indicator", I didn't mean to disclose it, just wanted to know how much you rely on something else.
Regards,
dk
hi ddkk
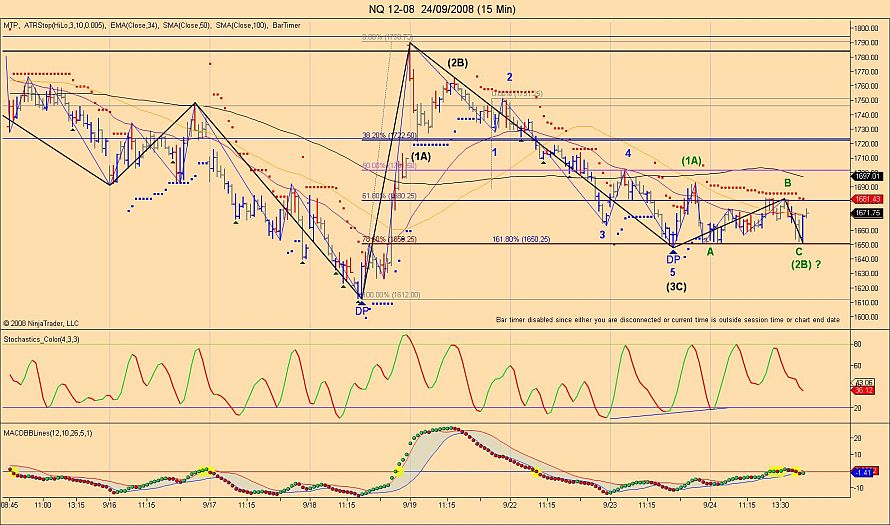
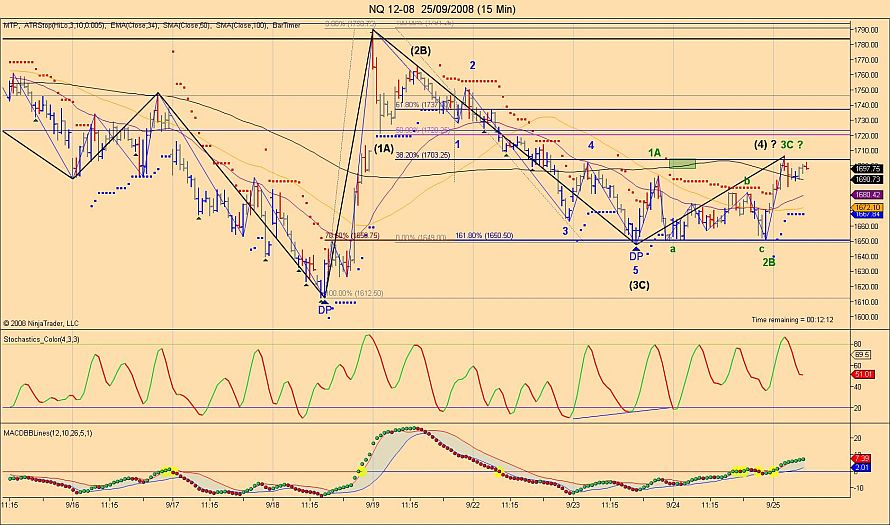
On these charts you will see some fib cluster zones, and based on the count and TTT plus divergence on the indicators, it was reasonable to expect a rally this morning.
At this point NQ ES and YM all came close to the TTT projected 3 day rally numbers.
TF is still lagging but as mentioned in last night report we had 90% chance of getting back above 703.60 and that has been achieved so far today.
Click image for original size
Click image for original size
Hello,
I have been following this thread for some time now and I have to say I often find myself sitting in amazement in front of the screen. Both TTT and EW are techniques I had either never heard of ( Taylor) or never considered worth studying (EW) and I'm happy to now see them used in a fascinating conjunction ! I am now seriously reconsidering studying EW and have also the TTT book now on my "to buy list" !
With regard to the question asked above concerning the fib clusters...are there any tips and hints to be found in EW books ?
This may sound dumb, but I wonder if there are any rules for drawing fibonacci extensions and retracements ? I find it hard to replicate your fib cluster zones in your charts, that's why I'm asking. I have drawn many fib zones in my charts in the past and also looked for confluences, but I often found them to be not relevant...they were nowhere as accurate as Larry's.
And regarding the mentioned "indicator", was ddkk refering to the "decision point" ? I thought it comes with Market Predictor, but I might be wrong.
Anyway, please keep on posting, Richbois and Larry22, it's highly appreciated !
P.S. @ Richbois: I will order the original TTT e-book through you once my Paypal acc. is funded again !
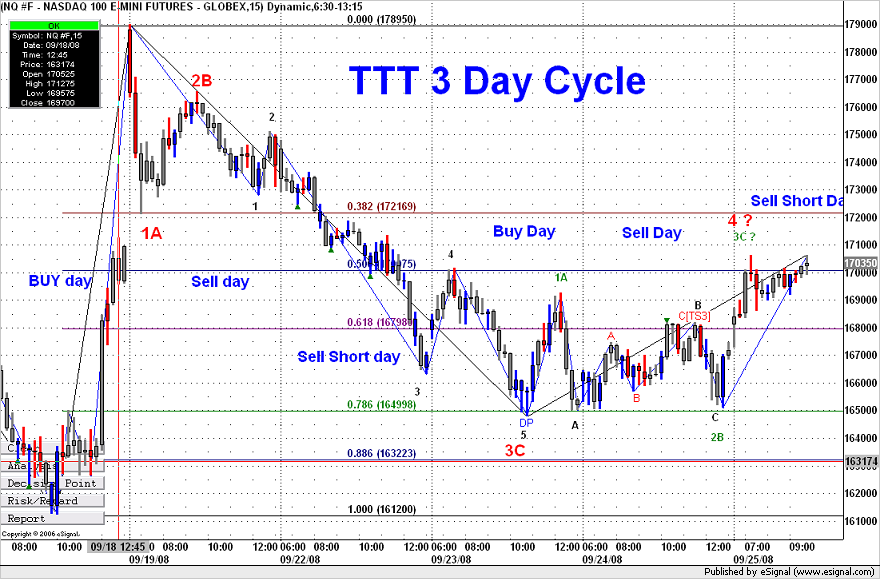
TTT 3 Day cycle
Using the same chart we can also see the TTT pattern for the last 2 cycles.
Sept 18 was Buy day and after a decline we found our buy point at 1612-15 area. The market then rallied and blew right through any projections to a top on the Sell day. We then started to correct that extreme move on the Sell day and continued on the SellShort day
and came down to close as a normal average 3 day rally.
Sept 23 starts a new cycle. We had done a good decline already but we had a 62% chance of making a lower low and that was accomplished.
Sept 24 the Sell day (confusing day) we rallied a bit but it was more a back and fill day.But as you can see that completed our wave 2B.
Today based on the count and the TTT average 3 day rally projections it was very reasonable to expect the rally we had.
Click image for original size
- Page(s):
- 37
- 38
- 39
- 40
- 41
- 42
- 43
- 44
- 45
- 46
- 47
- 48
- 49
- 50
- 51
- 52
- 53
- 54
- 55
- 56
- 57
- 58
- 59
- 60
- 61
- 62
- 63
- 64
- 65
- 66
- 67
- 68
- 69
- 70
- 71
- 72
- 73
- 74
- 75
- 76
- 77
- 78
- 79
- 80
- 81
- 82
- 83
- 84
- 85
- 86
- 87
- 88
- 89
- 90
- 91
- 92
- 93
- 94
- 95
- 96
- 97
- 98
- 99
- 100
- 101
- 102
- 103
- 104
- 105
- 106
- 107
- 108
- 109
- 110
- 111
- 112
- 113
- 114
- 115
- 116
- 117
- 118
- 119
- 120
- 121
- 122
- 123
- 124
- 125
- 126
- 127
- 128
- 129
- 130
- 131
- 132
- 133
- 134
- 135
- 136
- 137
- 138
- 139
- 140
- 141
- 142
- 143
- 144
- 145
- 146
- 147
- 148
- 149
- 150
- 151
- 152
I hope all you TTT traders had a good 2014 and I wish you all a better 2015
Richard
Richard
Emini Day Trading /
Daily Notes /
Forecast /
Economic Events /
Search /
Terms and Conditions /
Disclaimer /
Books /
Online Books /
Site Map /
Contact /
Privacy Policy /
Links /
About /
Day Trading Forum /
Investment Calculators /
Pivot Point Calculator /
Market Profile Generator /
Fibonacci Calculator /
Mailing List /
Advertise Here /
Articles /
Financial Terms /
Brokers /
Software /
Holidays /
Stock Split Calendar /
Mortgage Calculator /
Donate
Copyright © 2004-2023, MyPivots. All rights reserved.
Copyright © 2004-2023, MyPivots. All rights reserved.